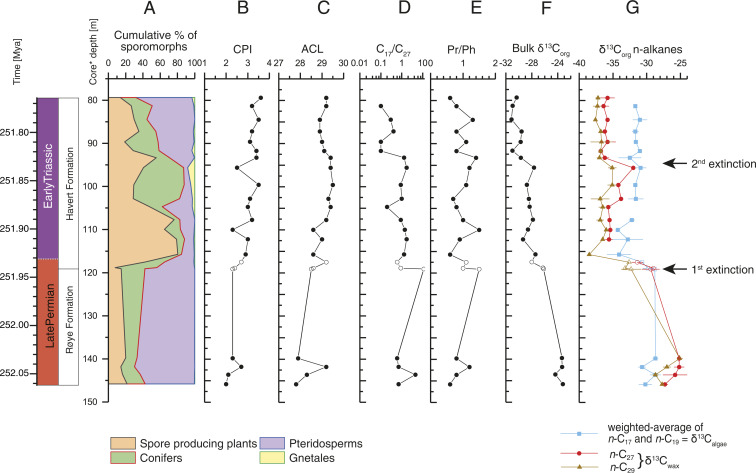
Fig. 2.
(A) Relative abundances of major groups of terrestrial palynomorphs. (B) Carbon preference index. (C) ACL of n-alkanes C25-C33. (D) Ratio between C17 and C27 n-alkane abundance. (E) Pristane/phytane (Pr/Ph) ratio. (F) Bulk organic δ13C values (δ13Corg) measured in this study. (G) Compound-specific δ13C values of C27 and C29 n-alkanes (δ13Cwax) and the weighted average of C17 and C19 n-alkanes (δ13Calgae). Error bars represent the SD based on multiple analysis of the same sample. Individual values and SDs are given in SI Appendix, Table S6, and core depth refers to core 7128/12-U-01 (indicated by solid marks) with samples from 7129/10-U-01 (indicated by hollow marks) correlated as shown in SI Appendix, Fig. S2 and Table S5. The astronomically tuned age model (left) is detailed in Fig. 3.

