Fig. 3.
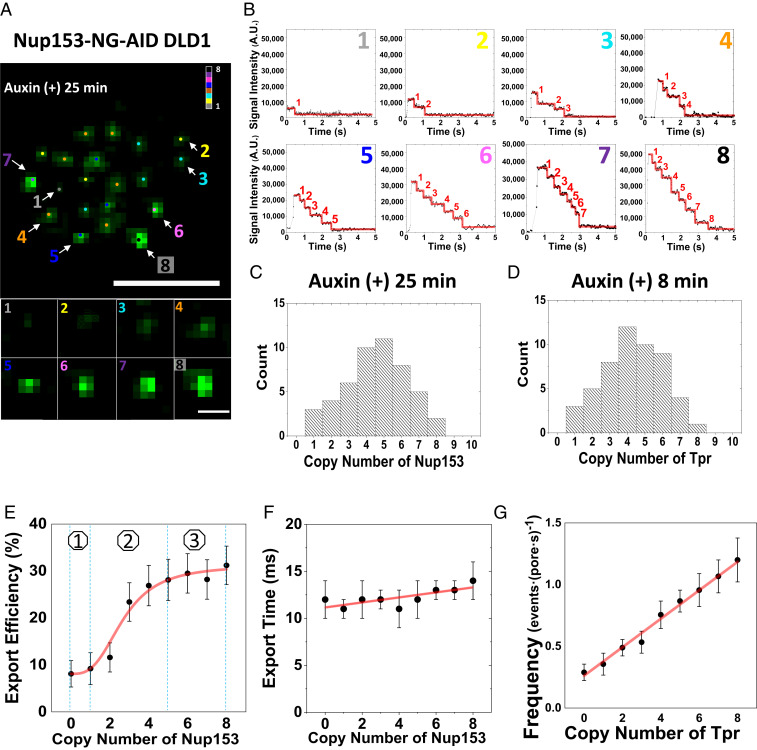
Export kinetics of mRNPs at various depletion rates of BSK-Nups. (A) The wide-field epi-fluorescent image of NPCs (green spots) harboring Nup153-NG on the bottom of DLD-1 Cell NE after 25-min auxin-inducible degradation. Different NPCs were found to contain different copy numbers of Nup153 after the treatment. (Scale bar: 5 μm.) Pointed NPCs with different copies of Nup153 are enlarged at the bottom. (Scale bar: 1 μm.) Numbers denote the copy number of Nup153-NG. (B) The photobleaching curves show one to eight copy numbers of Nup153 in the pointed eight NPCs shown in A. Numbers denote the copy number of Nup153-NG. (C) The frequency distribution for the copy number of Nup153-NG per NPC in live DLD-1 cells after 25-min auxin-inducible degradation. (D) The frequency distribution for copy number of Tpr-NG per NPC in live DLD-1 cells after 8-min auxin-inducible degradation. (E) Correlation between copy number of Nup153 and mRNP’s nuclear export efficiency in DLD-1 cells. The curve is perfectly fitted by the sigmoid function (red line) yielding the three phases: lag phase, intermediate phase, and plateau phase. (F) Correlation between the copy number of Nup153 and successfully export time of mRNPs in DLD-1 cells. (G) The frequency of mRNPs anchoring on NPCs with the copy number of Tpr from zero to eight, which is fitted with the linear function (red line).

