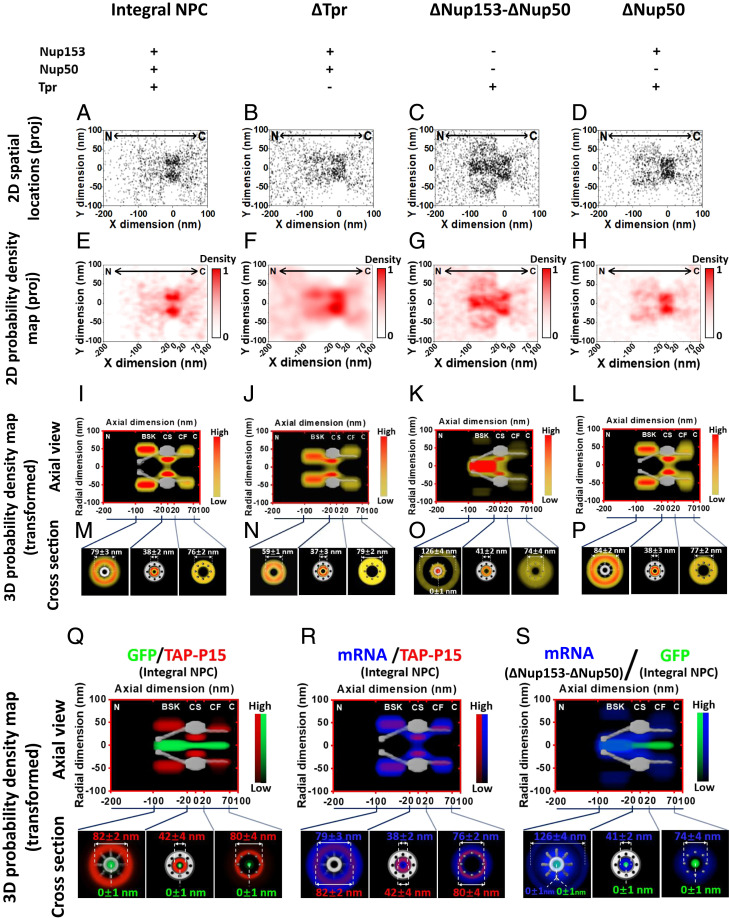
Fig. 4.
Export routes of mRNPs in the whole NPC under different conditions. (A–D) 2D spatial localizations of mRNP diffusion in and around integral NPCs, ∆Tpr NPCs, ∆Nup153 NPCs, and ∆Nup50 NPCs, respectively. The centroid of the NPC was firstly determined directly from labeled NPC and then further refined by single-molecule tracking data described in Determinations of NPC’s Centroid on page 10 and 11 of the SI Appendix as well as SI Appendix, Fig. S12. Based on the NPC structure obtained by EM study, we defined the axial length of nuclear basket, central scaffold, and cytoplasmic fibril as 80 nm, 40 nm, and 50 nm, respectively. C, cytoplasm; N, nucleus; proj, projection. (E–H) 2D probability density map of mRNP diffusion in and around integral NPCs, ∆Tpr NPCs, ∆Nup153 NPCs, and ∆Nup50 NPCs, respectively. C, cytoplasm; N, nucleus; proj, projection. Color bar shows density from low to high. (I–L) An axial view of 3D probability density maps is shown for mRNPs in NPC, including the nuclear basket, central scaffold, and cytoplasmic fibril under four conditions. C, cytoplasm; CF, cytoplasmic fibril; CS, central scaffold; N, nucleus. Color bar shows density from low to high. (M–P) The corresponding cross section of 3D probability density maps is shown for mRNPs in each subregion of NPCs under four conditions with distances between radial density peaks. (Q) The superimposed 3D probability density maps of GFP (green) and TAP-p15 (red) demonstrating the distinct routes of passive diffusion and facilitated transport in the NPC. The corresponding cross section of 3D probability density maps is shown for each subregions of NPCs with distances between radial density peaks. C, cytoplasm; CF, cytoplasmic fibril; CS, central scaffold; N, nucleus. Color bar indicates density from low to high. (R) The overlapping 3D probability density maps of mRNPs (blue) and TAP-p15 (red) showing their highly overlapped routes. The corresponding cross section of 3D probability density maps is shown for each subregion of the NPC with distances between radial density peaks. C, cytoplasm; CF, cytoplasmic fibril; CS, central scaffold; N, nucleus. Color bar shows density from low to high. (S) The superimposed 3D probability density maps of mRNPs (blue) in ∆Nup153 NPC and GFP (green) indicating mRNPs passively diffuse into the central axial region in the nuclear basket. The corresponding cross section of 3D probability density maps were shown for each subregions of NPCs with distances between radial density peaks. C, cytoplasm; CF, cytoplasmic fibril; CS, central scaffold; N, nucleus. Color bar shows density from low to high.

