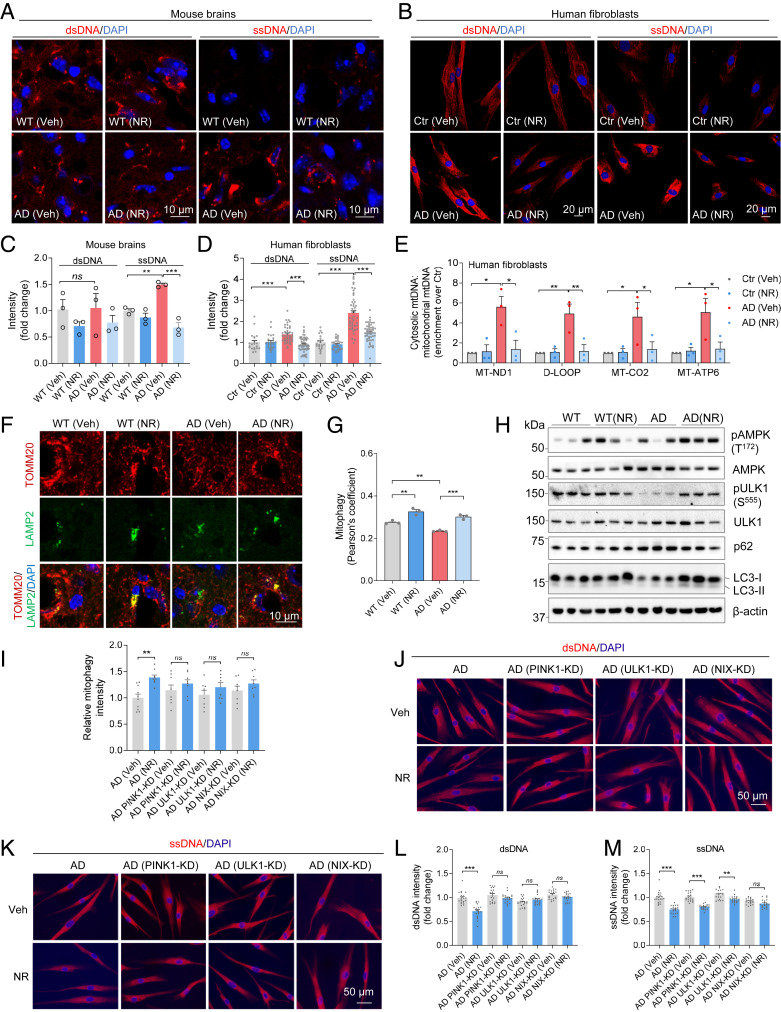
Fig. 4.
NR decreases cGAS–STING by decreasing cytoplasmic DNA. (A) Immunostaining of dsDNA and ssDNA with DAPI in mouse brain sections. n = 3 mice per group. (B) Immunostaining of dsDNA and ssDNA with DAPI in AD human fibroblasts and control fibroblasts. n = 21 to 58 cells per group were analyzed. (C) Quantification of dsDNA and ssDNA in A. n = 3 mice per group. (D) Quantification of dsDNA and ssDNA in B. (E) Total DNA was harvested from cytosolic and mitochondrial fractions of human fibroblasts and analyzed by qPCR. Cytosolic mtDNA genes were normalized to respective mitochondrial mtDNA genes (mt-ND1, D-loop, MT-CO2, MT-ATP6) and presented as fold enrichment over vehicle-treated controls (Methods). n = 3 biological repeats. (F) Immunostaining of TOMM20 and LAMP2 with DAPI in mouse brain sections. (G) Quantification of mitophagy (colocalization of TOMM20 and LAMP2) in F. n = 3 mice per group. (H) Western blots of specific proteins in NR- or vehicle-treated AD and WT mice brain cortex. n = 3 mice per group. (I) Relative mitophagy intensity in AD human fibroblasts after some key mitophagy genes knockdown. Quantification of mitophagy in SI Appendix, Fig. S5A. n = 8 to 10 images per group were analyzed. (J) Immunostaining of dsDNA with DAPI in AD human fibroblasts after some mitophagy genes knockdown. (K) Immunostaining of ssDNA with DAPI in AD human fibroblasts after some mitophagy genes knockdown. (L and M) Quantification of dsDNA and ssDNA in J and K. n = 20 cells per group were analyzed. Data: mean ± SEM. Statistical significance was performed with two-way ANOVA followed by Tukey’s multiple comparisons test. *P < 0.05, **P < 0.01, ***P < 0.001. Ns, not significant.

