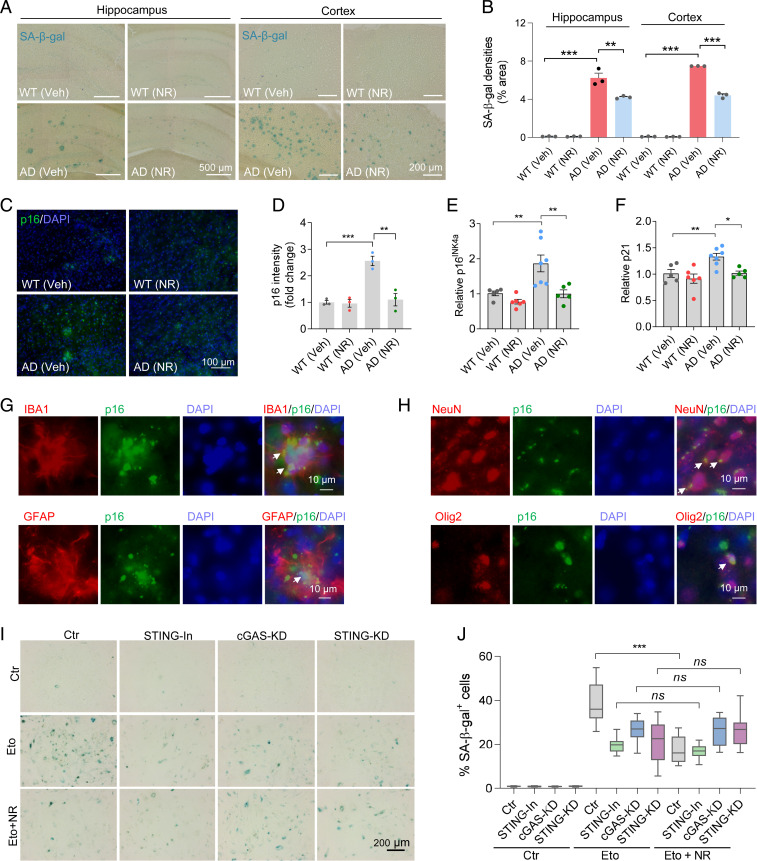
Fig. 5.
NR decreases cellular senescence in AD mouse brains. (A) Representative SA-β-gal staining in NR- or vehicle-treated AD or WT mice hippocampi and cortex. The panels of the hippocampus are part of the pictures after stitching the entire hippocampus with mosaic tile scan of microscope, and some of the stitching areas are still visible. (B) Quantification of SA-β-gal staining densities in A. n = 3 mice per group. (C) Representative p16INK4a staining in NR- or vehicle-treated AD or WT mouse brains. (D) Quantification of p16INK4a staining intensity in C. n = 3 mice per group. (E and F) Real-time qPCR of relative p16INK4a and p21 mRNA levels. n = 5 to 7 mice per group. (G) Immunofluorescence of microglia marker IBA1 (red) or astrocyte marker GFAP (red) with cellular senescence marker p16INK4a (green) in AD mouse brains. White arrows point to colocalization. (H) Immunofluorescence of neuron marker NeuN (red) or oligodendrocyte progenitor cell marker Olig2 (red) with cellular senescence marker p16INK4a (green) in AD mouse brains. White arrows point to colocalization. (I) Representative SA-β-gal staining in etoposide- (Eto, 3 µM for 24 h and then washed the cells with fresh medium and incubated them an additional 4 d) or vehicle-treated HMC3 microglia cells. Cells were treated with STING inhibitor, or cGAS siRNA, or STING siRNA. (J) Quantification of SA-β-gal positive cells in I. n = 18 pictures per group. Data: mean ± SEM. Statistical significance was performed with two-way ANOVA followed by Tukey’s multiple comparisons test. *P < 0.05, **P < 0.01, ***P < 0.001. Ns, not significant.

