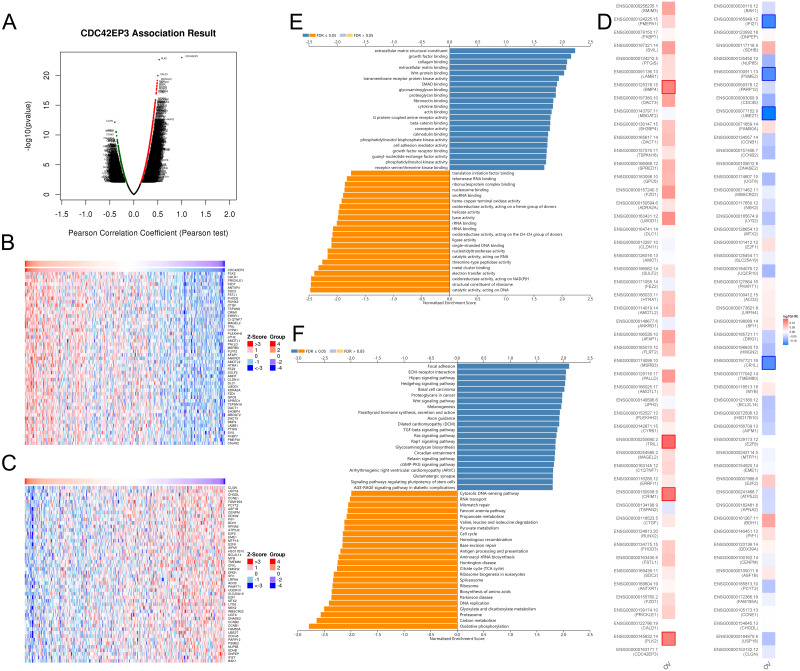
Figure 4. The co-expression genes with CDC42EP3 in ovarian cancer by the LinkedOmics database.
(A) The significantly associated genes with CDC42EP3 analyzed by Pearson correlation in ovarian cancer cohort. (B–C) Heatmaps of the top 50 genes positively and negatively correlated with CDC42EP3 in ovarian cancer, respectively. Red dots indicate the positively correlated genes and blue dots indicate the negatively correlated genes. (D) Survival maps depicting the top 50 genes positively and negatively related to CDC42EP3 in ovarian cancer, respectively. (E–F) GO annotations and KEGG pathways of CDC42EP3-associated network in ovarian cancer cohort.

