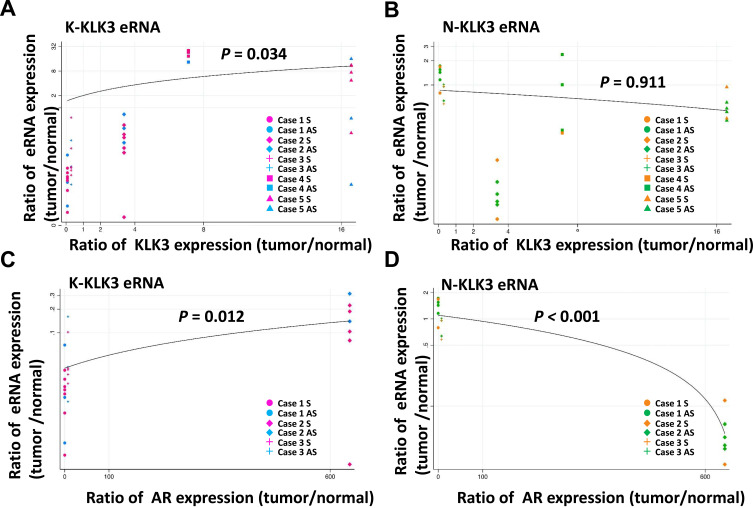
Figure 1.
Correlation between expression of KLK3eRNAs and KLK3 or AR mRNA in the patient samples. The ratio of RNA expression level (tumor/normal) of (A and B) KLK3 mRNA in the five patients and (C and D) AR mRNA in the three patients are indicated in the X-axis. The ratio of RNA expression level (tumor/normal) of (A and C) reported and (B and C) novel eRNA were plotted in the Y-axis in each patient. The colors of plots correspond to primer sets shown in Figure 2. A linear regression line was fitted to the plots on the logarithmic Y-axis. Expression levels of AR in cases 4 and 5 were not evaluable. qRT-PCR could not detect RNA in some combinations of sample and primer set due to extremely low expression. If RNA level of either tumor or normal tissues in a patient were not detected using a primer set, we defined this undetectable Ct value as 40, the minimum detectable value of the qRT-PCR assay. P-values in the figure are the regression outputs. P-value less than 0.05 was considered statistically significant in this study, meaning that there was a statistically significant relationship in (A, C and D).

