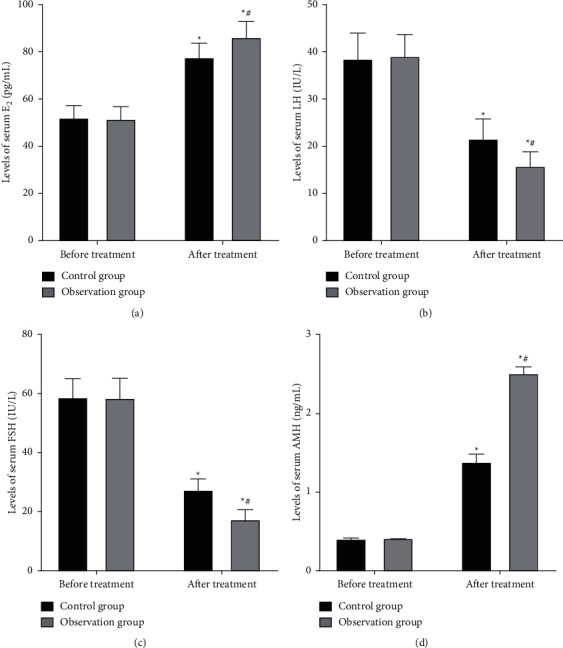
Figure 2.

Comparison of serological indicators between the two groups ( ± s). (a) Levels of serum E2. The levels of the control group before and after treatment were (52.45 ± 5.73) and (78.15 ± 6.53) pg/mL, respectively. The levels of the observation group before and after treatment were (51.98 ± 5.81) and (86.71 ± 7.18) pg/mL, respectively. (b) Levels of serum FSH. The levels of the control group before and after treatment were (59.13 ± 6.85) and (27.64 ± 4.18) IU/L, respectively. The levels of the observation group before and after treatment were (58.87 ± 7.14) and (17.62 ± 3.74) IU/L, respectively. (c) Levels of serum LH. The levels of the control group before and after treatment were (38.79 ± 5.75) and (21.78 ± 4.51) IU/L, respectively. The levels of the observation group before and after treatment were (39.32 ± 4.86) and (15.96 ± 3.37) IU/L, respectively. (d) Levels of serum AMH. The levels of the control group before and after treatment were (0.41 ± 0.03) and (1.39 ± 0.12) ng/mL, respectively. The levels of the observation group before and after treatment were (0.42 ± 0.01) and (2.52 ± 0.10) ng/mL, respectively. ∗Comparison with the same group before treatment, P < 0.05; #comparison with the control group after treatment, P < 0.05.
