Figure 1.

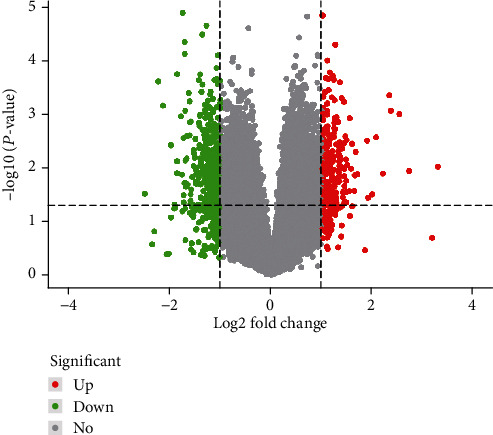
Volcano plot of DEGs. Red represents high expression, green represents low expression, and black represents no difference.

Volcano plot of DEGs. Red represents high expression, green represents low expression, and black represents no difference.