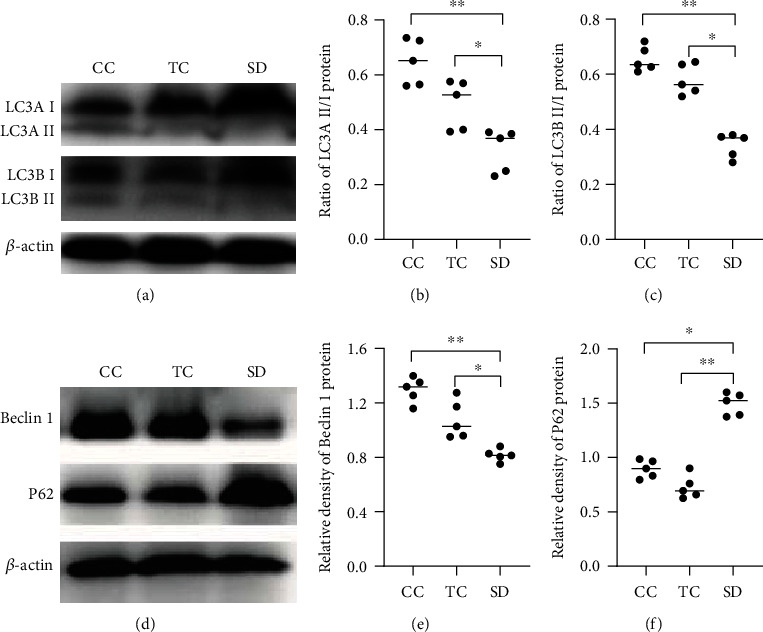
Figure 4.

SD inhibited autophagic activity in the thyroid. (a) Expression of LC3. (b) LC3A II/LC3A I ratios. (c) LC3B-II/LC3B-I ratios. (d) The representative expression of Beclin 1 and P62 was measured by western blotting. The relative densities of the bands of (e) Beclin 1 and (f) P62 in each lane were analyzed and normalized to β-actin. Data are shown as the median (bar), and scatter plots are shown. ∗P < 0.05, ∗∗P < 0.01, compared with rats in the CC or TC group; n = 5 in each group.
