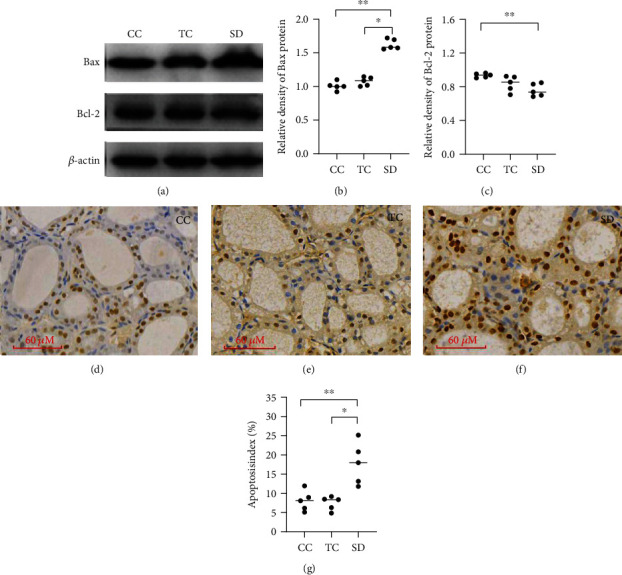
Figure 5.

SD affected apoptosis in rat thyroids. (a) Expression of Bax and Bcl-2 was measured by western blotting. The relative densities of the bands of (b) Bax and (c) Bcl-2 in each lane were analyzed and normalized to β-actin. Data are shown as the median (bar), and scatter plots are shown. Apoptosis in the thyroid of the CC group (d), TC group (e), and SD group (f). TUNEL staining was used to quantify cell apoptosis, and apoptosis index (TUNEL-positive cells of total cells, %) was analyzed. ∗P < 0.05, ∗∗P < 0.01, compared with rats in the CC or TC group; n = 5 in each group.
