
Figure 4.
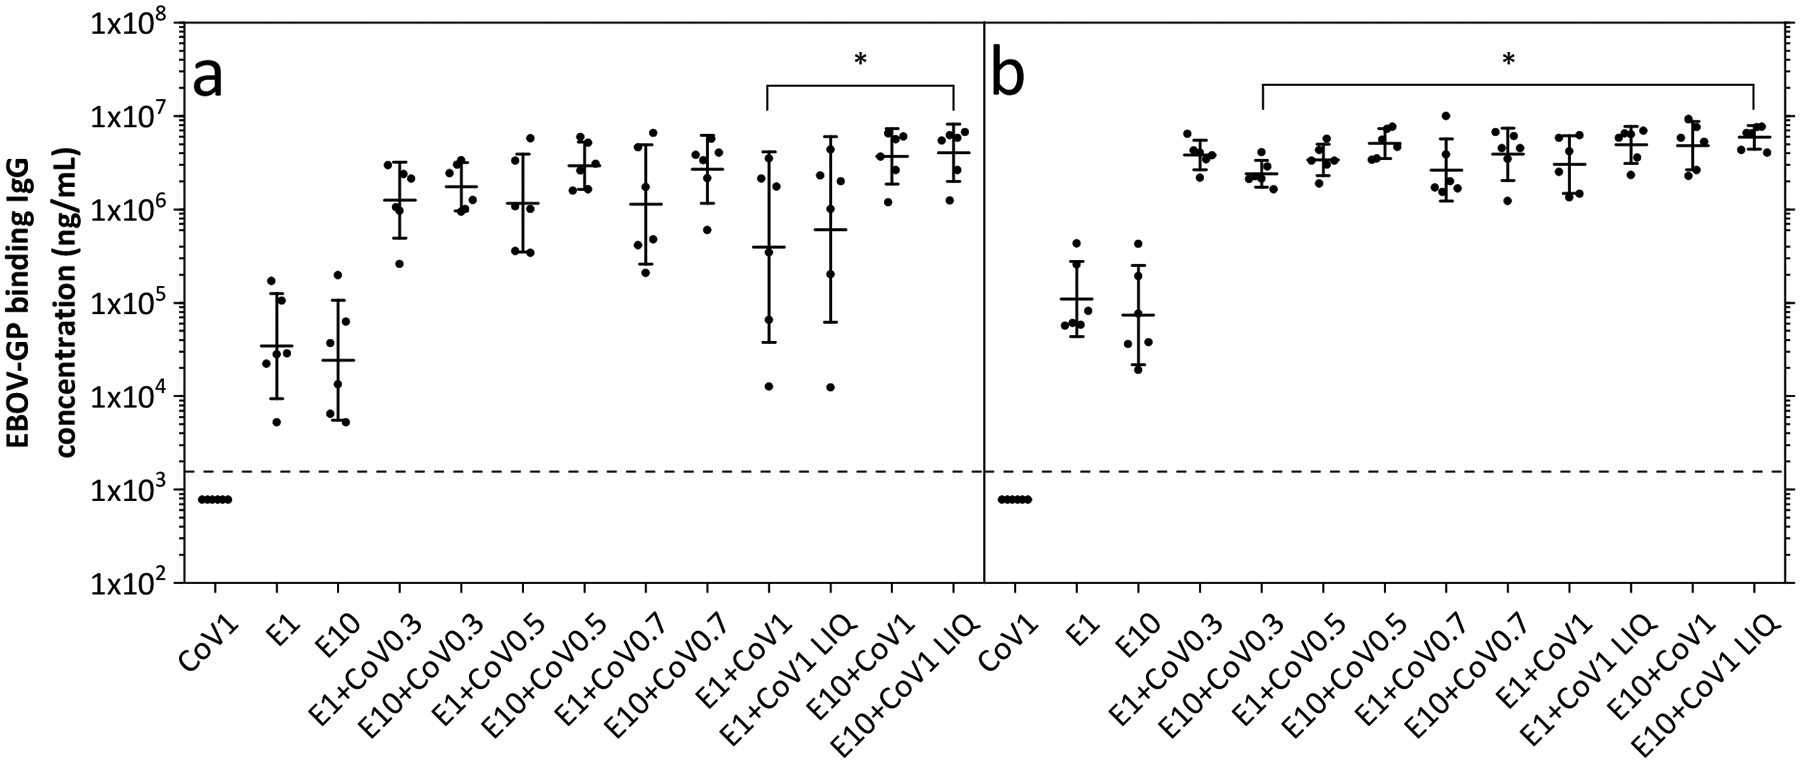
IgG responses in Study A: Adjuvant Dose Response Study. IgG concentrations specific to EBOV-GP from (a) post-dose 2 and (b) post-dose 3 mouse serum samples. Data are shown as geometric mean titers (GMT) ± 95% confidence interval. Each dot represents the IgG concentration measured from serum of one individual mouse. The dotted line represents the limit of quantification (LOQ); any values measured below this limit are shown here as half the LOQ. The numbers in the group labels are defined in Table 1 and refer to the dose of EBOV-GP (E; in μg) and adjuvant (CoV; in mg). Statistically significant differences are only shown determined for groups receiving both antigen and adjuvant, where * = p < 0.05.