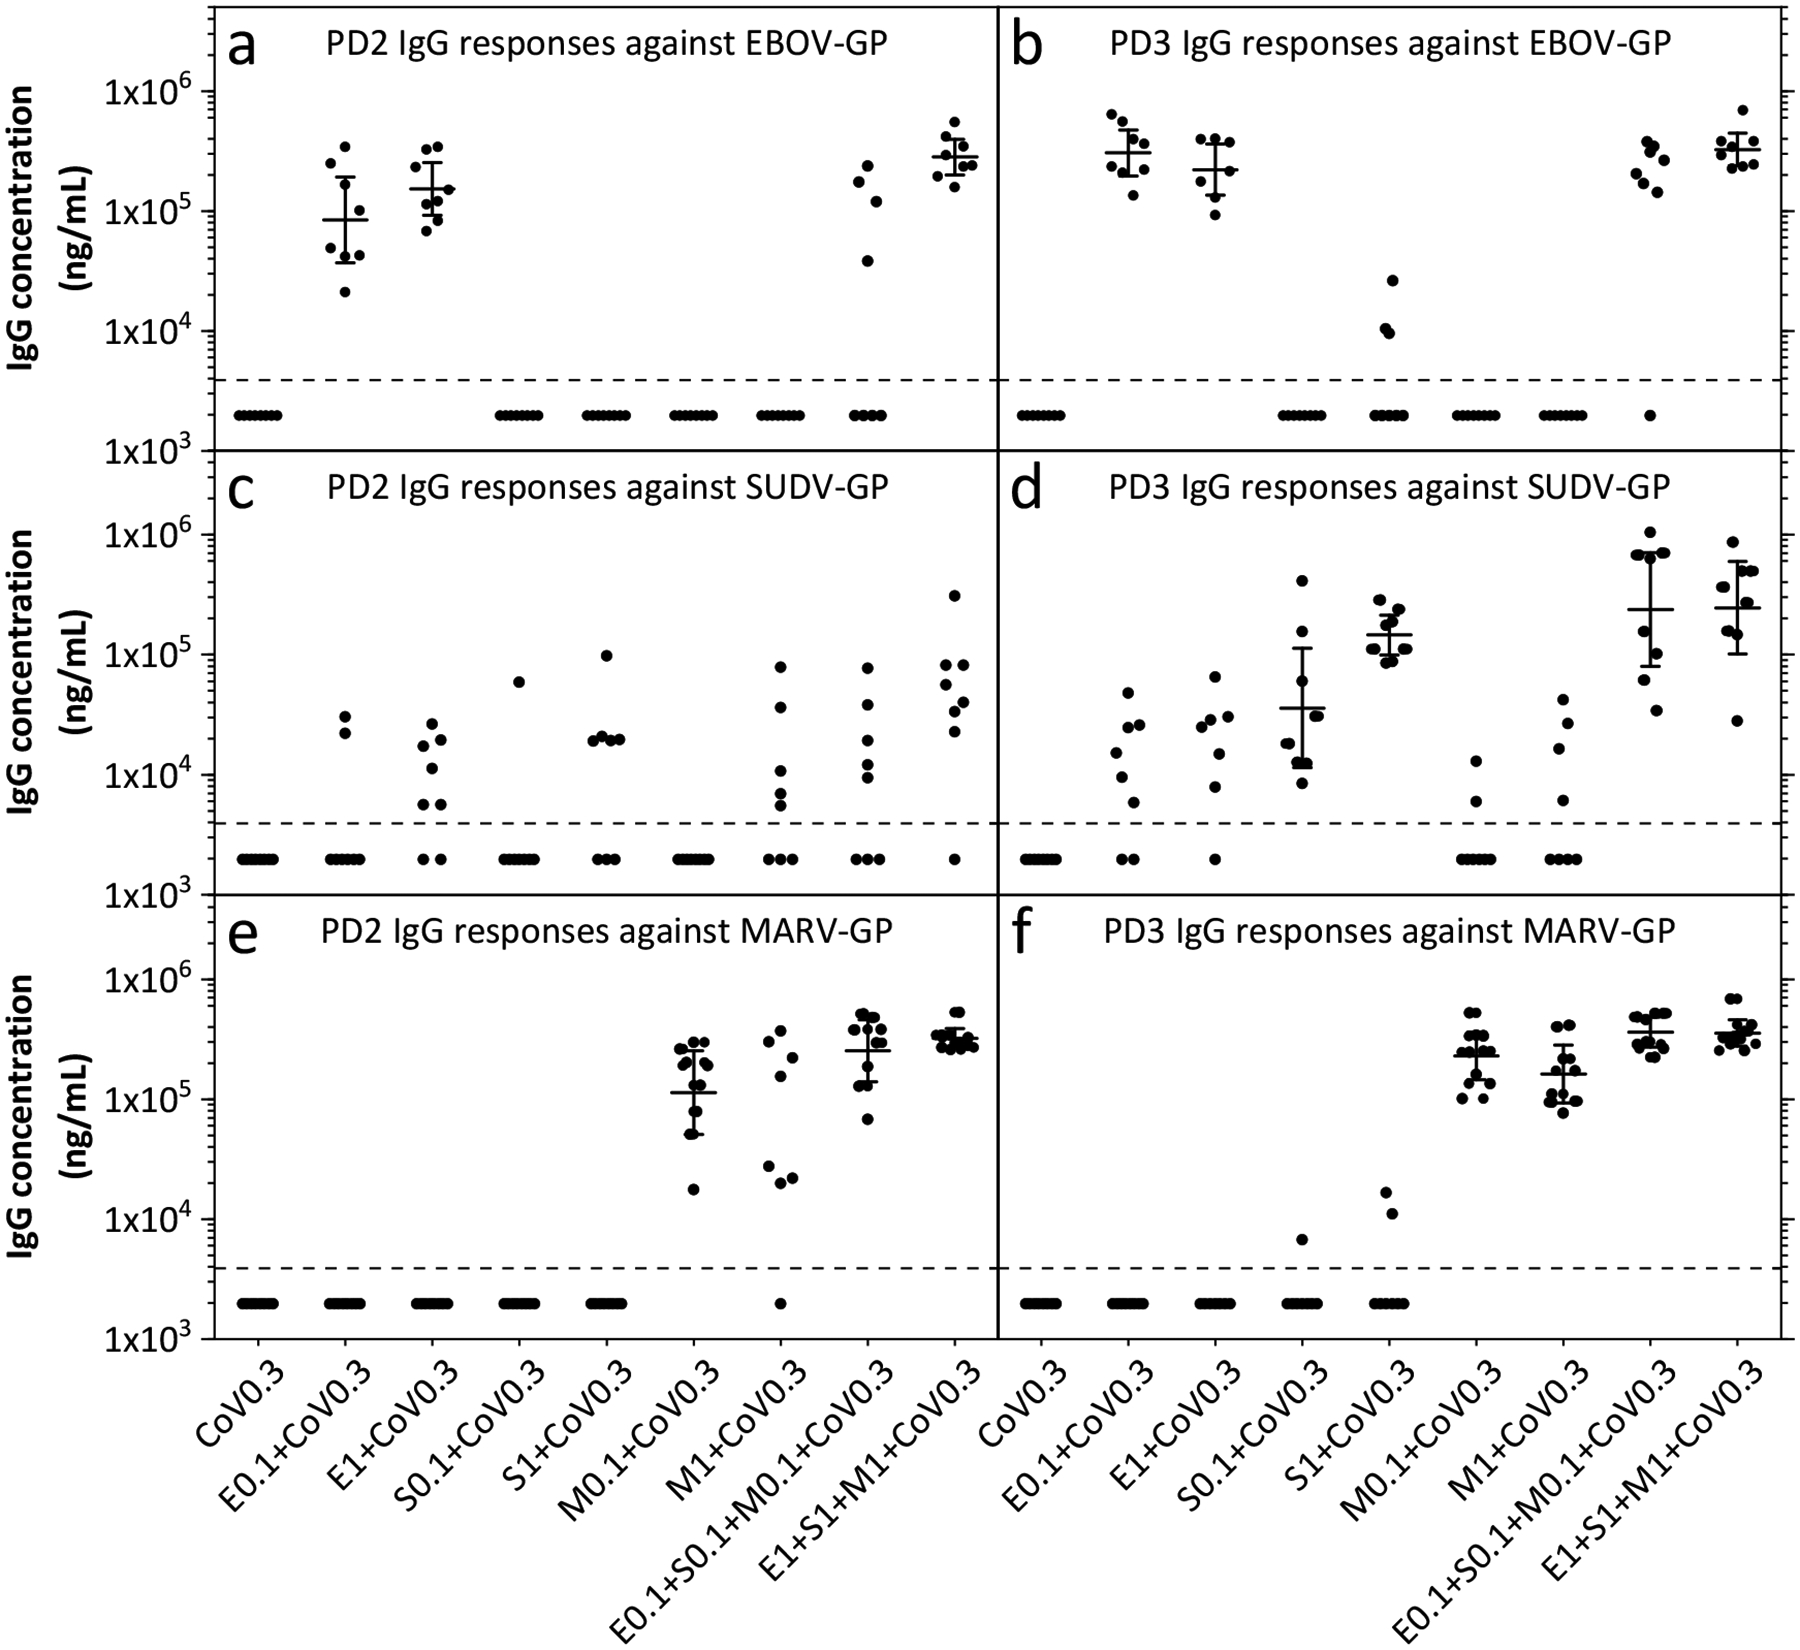
Figure 5.

Mouse immunogenicity results from Study B: Antigen Dose Response Study. Responses to immunizations are shown as IgG concentrations against (a,b) EBOV-GP, (c,d) SUDV-GP, and (e,f) MARV-GP. Each dot represents the antibody concentration measured from serum of one individual mouse. The dotted line represents the limit of quantification (LOQ); any values measured below this limit are shown here as half the LOQ. Data are shown at GMTs ± 95% confidence interval (where all values within a group are above the LOQ) from serum collected post dose two (PD2, left panels) and three (PD3, right panels). The numbers in the group labels are defined in Table 1 and refer to the dose of antigen (in μg) and adjuvant (in mg).
