
Figure 6.
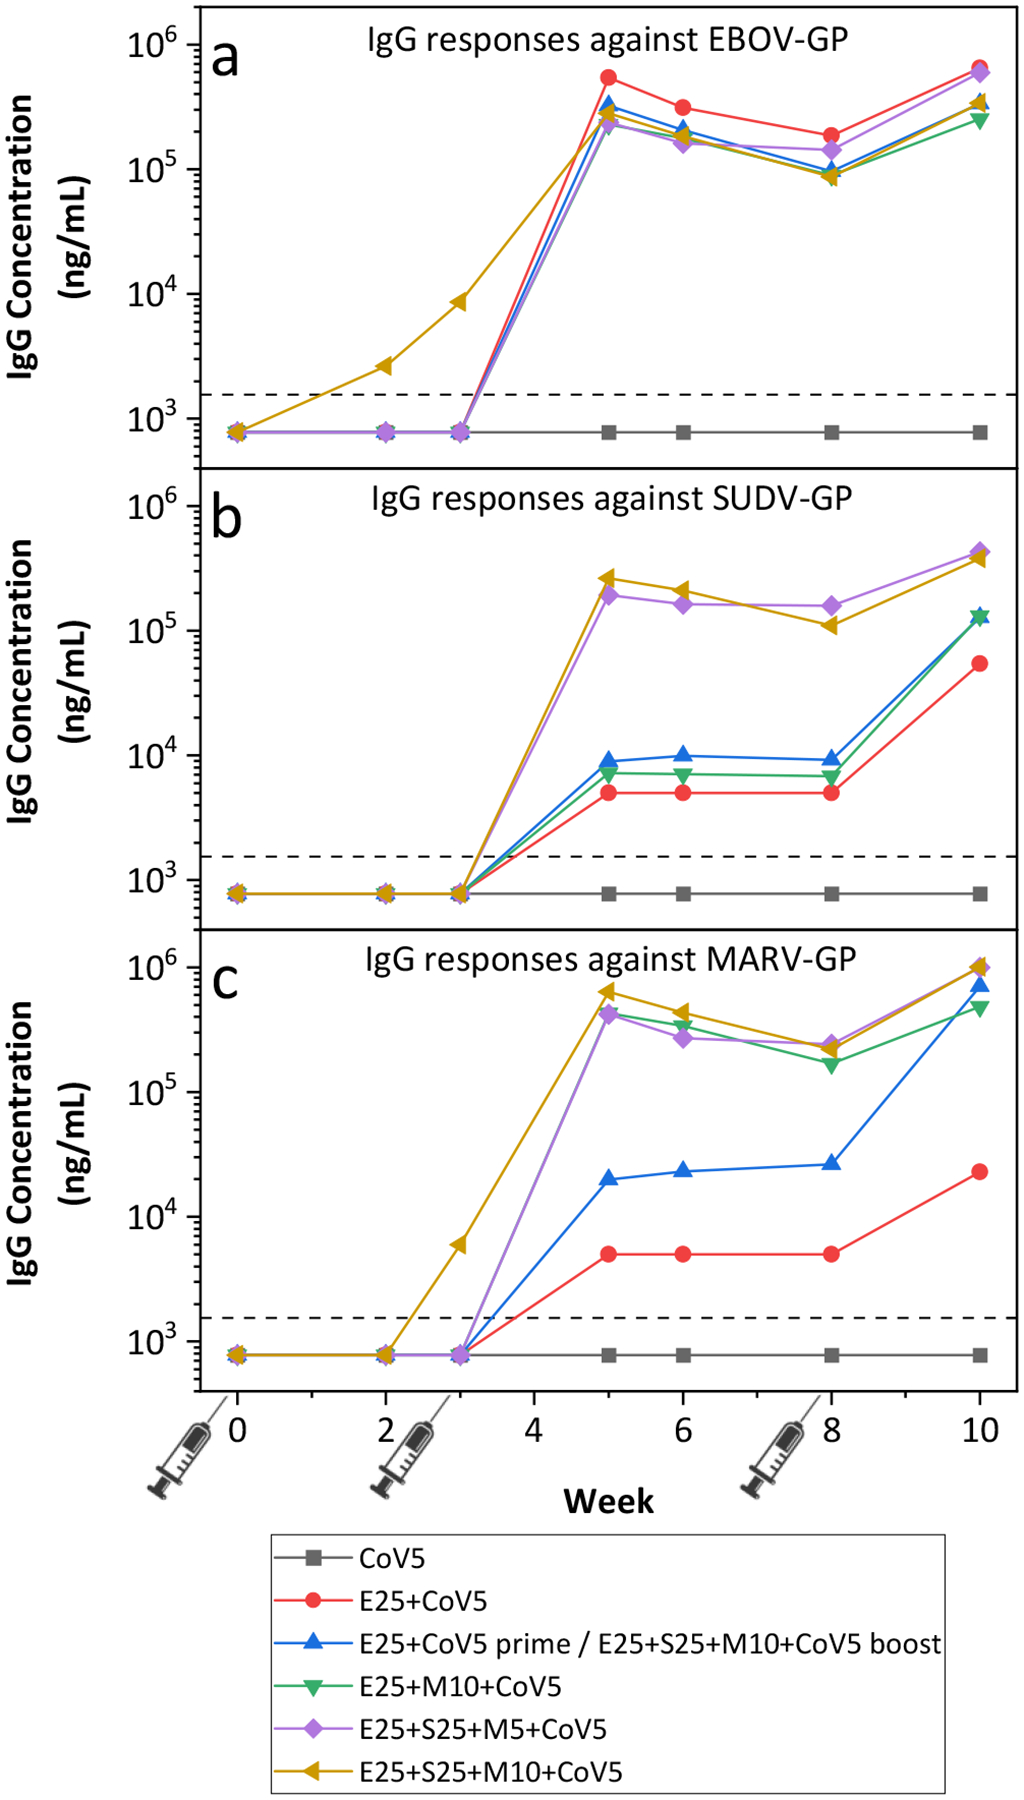
NHP immunogenicity from Study C with IgG responses against (a) EBOV-GP, (b) SUDV-GP, and (c) MARV-GP. Data are shown as GMTs from n = 3 animals per group, except for the CoV10 group with n = 1. The dotted line represents the limit of quantification (LOQ). If any primate in a group had a response less than the LOQ, the GMT is shown as half the LOQ. The numbers in the group labels are defined in Table 1 and refer to the dose of antigen (in μg) and adjuvant (in mg).