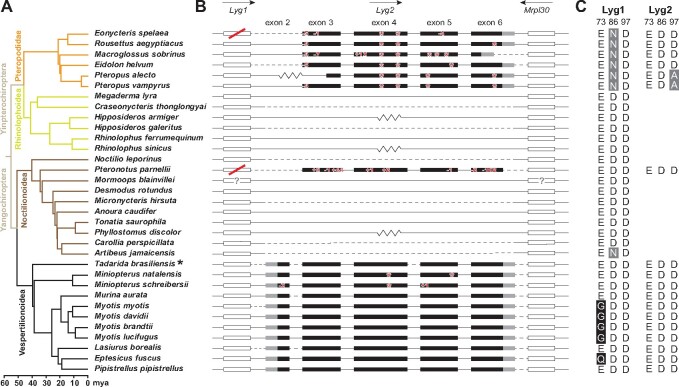
Fig. 2.
Loss of Lyg2 genes in bats based on published sequences. (A) Clades of different colors represent the different superfamilies of bats (Upham et al. 2019). For species marked with an asterisk, putative duplicated exons may exist. (B) Exons with coding regions for Lyg2 and its two flanking genes are displayed. The coding and untranslated regions are indicated in black and gray rectangles, respectively. Flanking genes (Lyg1 and Mrpl30) are indicated by hollow rectangles. Only exons are shown to scale, with introns indicated by horizontal lines. Arrows above the genes indicate the direction of gene transcription. Inactivating mutations in Lyg2 are marked with red numbers and asterisks. Lyg1 genes that do not have a complete open reading frame are marked with a red strike. Flanking genes that are not on the same scaffold and those that are in the same scaffold but whose sequence is not continuous with Lyg2 are indicated by the dotted and zig-zag lines, respectively. Flanking genes marked by question marks indicate that their positions are not the expected pattern. (C) Display of the key catalytic amino acid residue sites in Lyg1 and Lyg2. Numbering is based on goose Lyg. Black shading indicates that the amino acid change might have a large impact on the function of g-type lysozyme (site 73), whereas amino acid changes in gray shading might not affect the function (sites 86 and 97).

