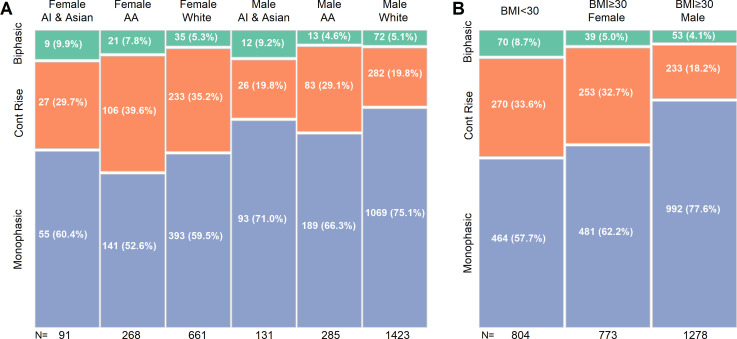
Figure 1.
Classification analysis of OGTT glucose response curve shapes by sex and race (A) and sex, race, BMI, waist to hip ratio, and duration of diabetes (B). In B, only sex and BMI remained as significant independent classifiers. The percentages within each column are shown on the plot. AA, African American; AI, American Indian; BMI, body mass index; OGTT, oral glucose tolerance test.

