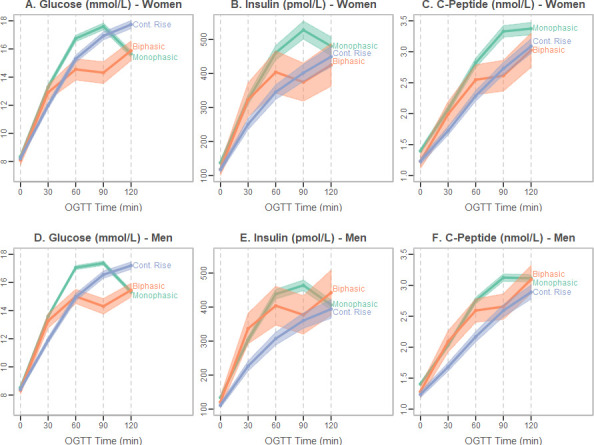
Figure 3.

OGTT glucose response curve shapes stratified by sex: monophasic, biphasic, or continuous rise. Mean glucose (A women, D men), insulin (B women, E men), and C peptide (C women, F men) are depicted at each OGTT time-point separately for participants within each of the subgroups. Pointwise 95% CIs are drawn around the means at each time-point. OGTT, oral glucose tolerance test.
