Figure 1.

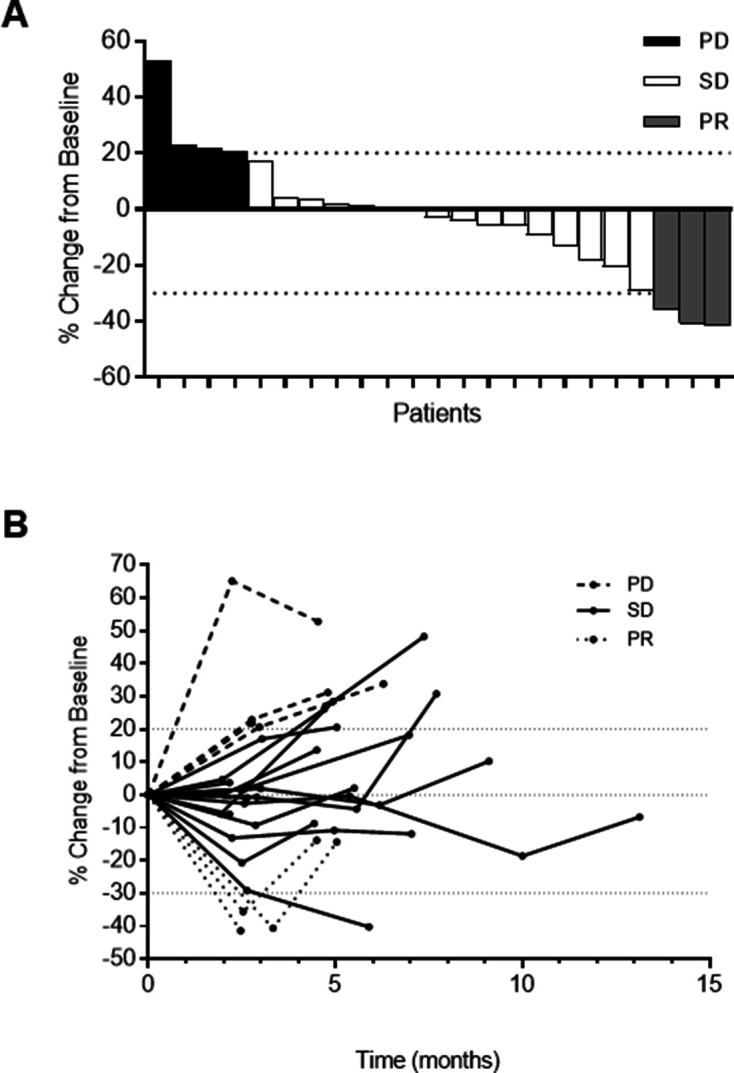
(A) Waterfall plot. Best percentage change in tumor size from baseline by RECIST V.1.1. (B) Spider plot. Percentage change in tumor size over time from baseline by RECIST V.1.1.

(A) Waterfall plot. Best percentage change in tumor size from baseline by RECIST V.1.1. (B) Spider plot. Percentage change in tumor size over time from baseline by RECIST V.1.1.