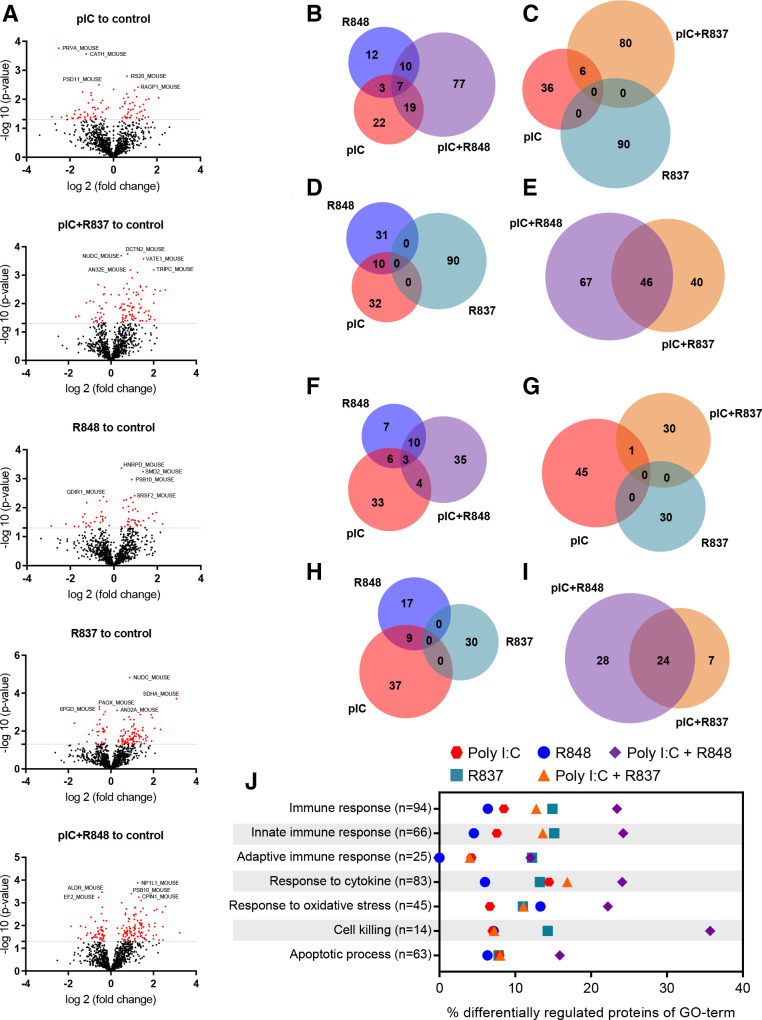
Figure 6.
Quantitative proteomic analysis of antitumor immune responses triggered in tumors treated with TLR agonist monotherapies or combinations. Immunocompetent lung cancer murine CMT167 subcutaneous tumors were treated with two intratumoral injections of TLR agonists alone or in combination, as indicated in online supplemental figure 6A. (A) Volcano plots of the SWATH analysis of proteins comparing TLR-treated versus control tumors. X-axis shows log2 (fold change) and Y-axis shows the statistical significance through −log10 (p value). The gray lines represent the cut-off (p≤0.05). Significantly upregulated and downregulated proteins are indicated by red dots. (B–I) Quantitative Venn diagrams showing the number of (B–E) upregulated and (F–I) downregulated proteins versus control, found in the tumor samples of treated mice (p≤0.05). (J) Differential protein expression for GO terms of interest. Each row represents the proportion of significantly changed proteins (p<0.05) involved in the process compared with control. n indicates the number of measured proteins for the process. n=3 tumors per group of treatment. GO, Gene Ontology; pIC, poly(I:C); R837, imiquimod; R848, resiquimod; TLR, toll-like receptor.

