Figure 6.
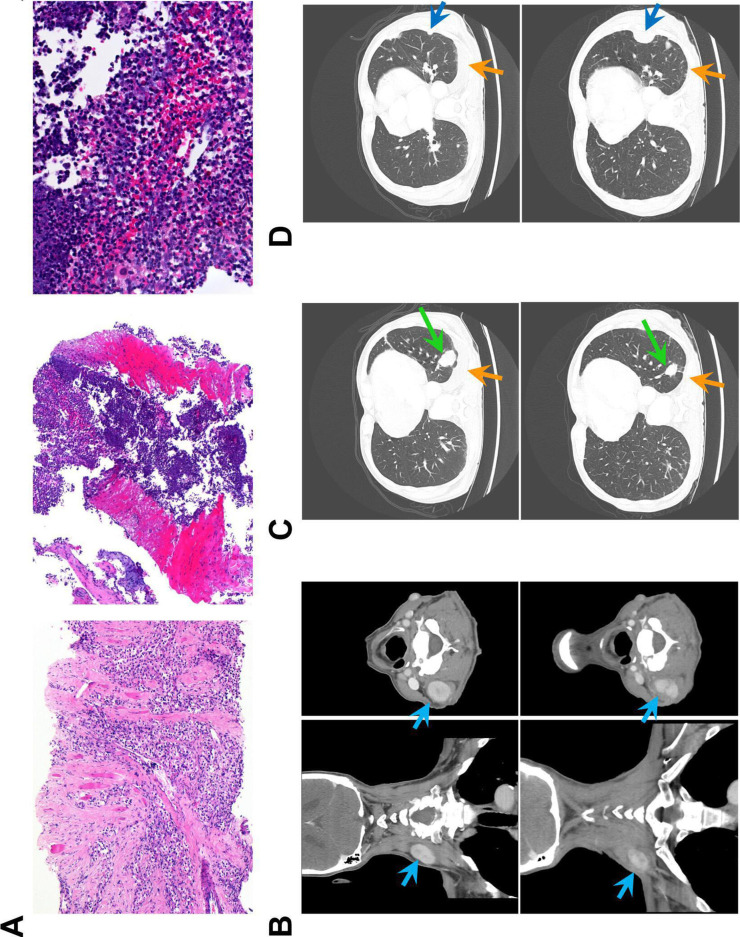
Histology and CT scans of treated patient. Patient 4 received three injections at 6-week intervals of 1 mL of CFA into a neck deposit of clear cell carcinoma of the kidney. (A) H&E sections of tumor on initial biopsy taken 1 year before CFA treatment (left x100) and on biopsy taken 4 days after the first injection of CFA (middle x100, right x400). The post-treatment biopsy shows extensive immune infiltrate (predominantly neutrophils and macrophages) and no viable tumor. (B–D) CT scans taken 8 days before the first injection (top row) and 5 weeks after the second injection (bottom row). An earlier scan is shown in online supplemental figure 5. (B) Scans of the neck showing the injected lesion (light blue arrow; 40×27 mm before treatment, 28×18 mm after two injections). (C) Scans of lung showing tumor shrinkage (green arrow; 33 mm before treatment, 21 mm after) and substantially reduced pleural effusion (orange arrows). (D) Scans of lung showing a tumor that continued to grow despite treatment (dark blue arrow; 9 mm before treatment, 33 mm after). CFA, complete Freund’s adjuvant.

