Figure 5.
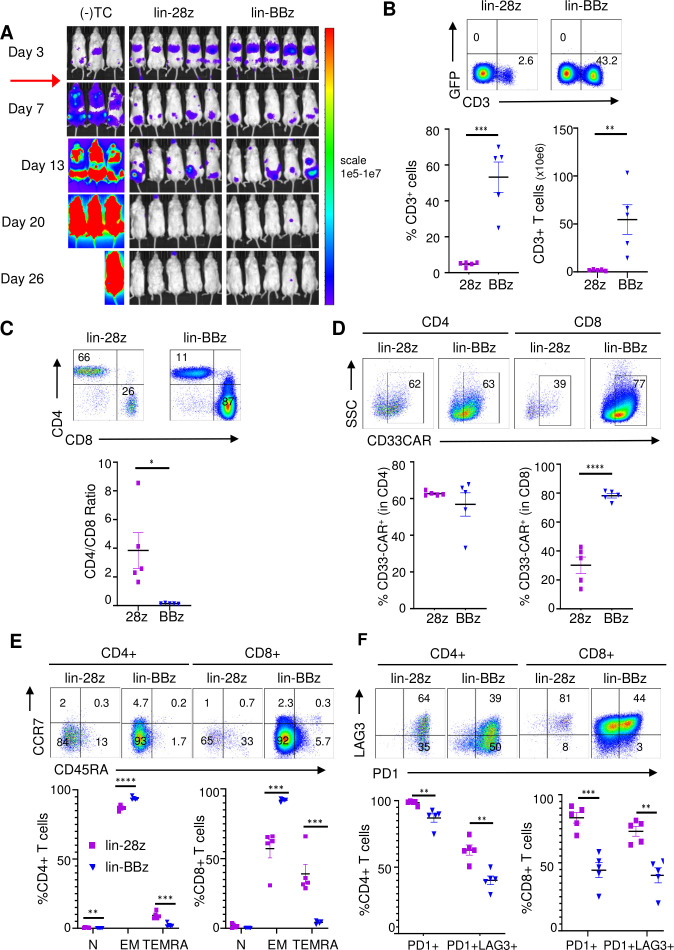
In vivo exhaustion potential of lintuzumab-based CD33 chimeric antigen receptor constructs (CD33CARTs) in an acute myeloid leukemia (AML) xenograft model. (A) Luciferase-expressing MOLM14 xenograft mice were created as in figure 3. Cohort of five mice were treated with one 4×10⁶ dose of GFP-transduced T cells ((-)TC), lintuzumab-CD28/CD3ζ (lin-28z), or lintuzumab-4-1BB/CD3z (lin-BBz) CD33CART intravenous on day 4 (red arrow), then followed by bioluminescent imaging. CD33CART transduction efficiency ranged from 19.9% to 88.3% for these experiments with information detailed in online supplemental table 1. (B) Representative dot plots show flow cytometric detection of percentages of human CD3+ CD33 CART cells in harvested end-study murine spleens at day 26 following T cell treatment (upper panels). T cell quantification (lower panels) detected greater numbers in lin-BBz-treated versus lin-28z-treated animals. (C) Representative dot plots show flow cytometric analysis of CD4/CD8 T cell profiles (upper panels) with ratio calculation (lower panel) in end-study murine spleens. (D) Similar percentages of cell surface CD33 CAR positivity (bound to recombinant CD33-Fc fusion protein) were detected in CD4+ T cells, but not CD8+ T cells, when comparing lin-28z and lin-BBz CD33CARTs. (E) Naïve (N), effector memory (EM), and effector memory re-expressing CD45RA (TEMRA) human T cells in murine spleens at the day 26 end-study timepoint were further characterized by CCCR7+ CD45RA+, CCR7-CD45RA-, and CCR7-CD45RA+ flow cytometric profiling, respectively. Representative plots for CD4+ and CD8+CD33CARTs are shown (upper panels) and quantification of the different populations within the CD4+ (left) and CD8+ (right) subsets are shown. (F) Exhaustion phenotypes of CD33CARTs were evaluated as a function of PD1 and PD1/LAG3 expression profiles and representative dot plots are presented with %cells designated numerically for each gated quadrant (top). Quantification of PD1+ and PD1+/LAG3 +CD4+ and CD8+ T cells in murine spleens at the day 26 end-study timepoint are shown for lin-28z versus lin-4BBz CD33CART treatments. Paired data were analyzed by Student’s t-test with *p<0.05, **p<0.01, ***p<0.001, and ****p<0.0001.

