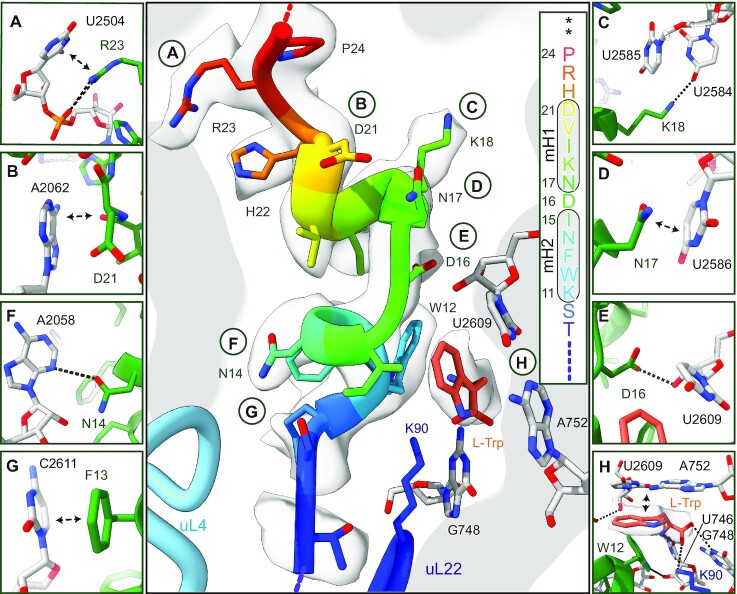
Figure 2.
Structure and molecular interactions of the TnaC-AP and L-Trp within the peptide exit tunnel. The central panel shows an overview and secondary structure of the TnaC-AP fitted into the electron potential map (transparent grey); panels (A–H) show zoomed views focusing on specific molecular interactions. See text for details. mH1 and mH2 = minihelix 1 and minihelix 2, asterisks indicate stop codons.

