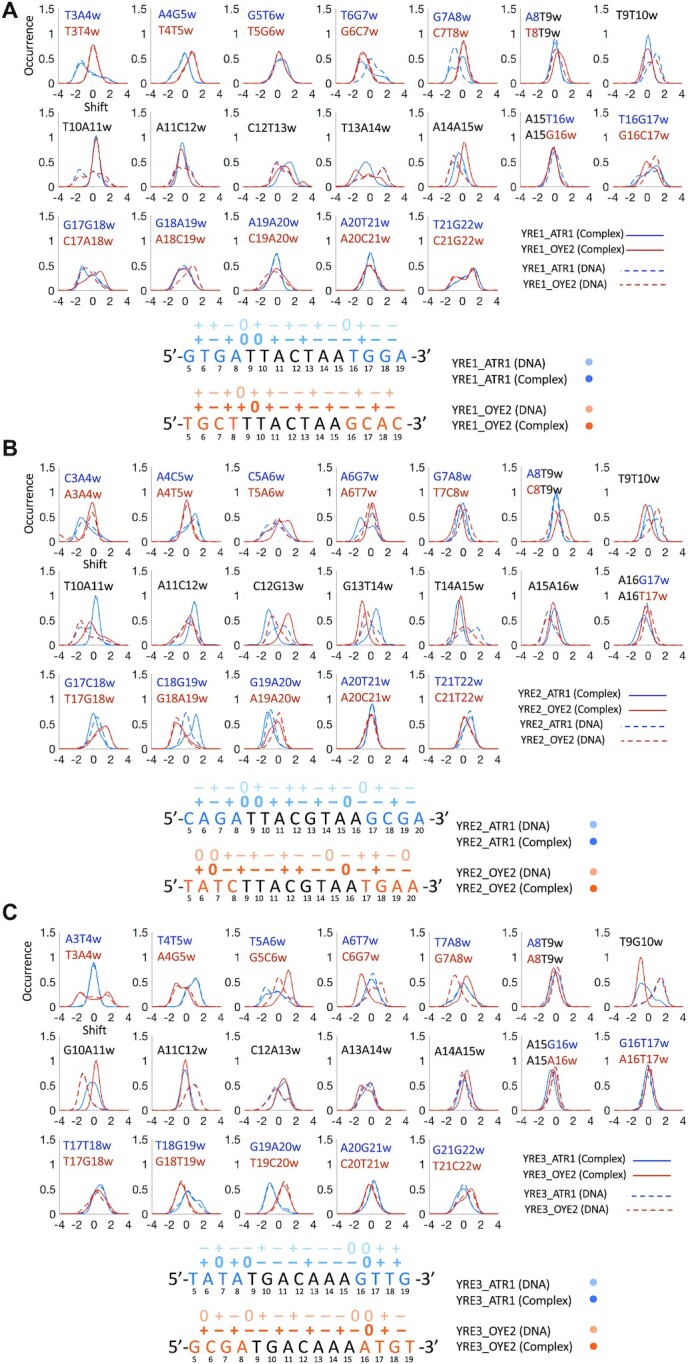
Figure 3.

Upper panels: normalised shift distributions for unbound (dashed lines) and Yap1-bound (thick lines) DNA. Bottom panels: most populated shift (the signs ‘–’, ‘+’ and ‘0’ indicate negative, positive and neutral shift) for unbound (light colour) and Yap1-bound (dark colour) for (A) YRE1, (B) YRE2, (C) YRE3. The genomic environments, ATR1 and OYE2, are coloured blue and orange, respectively.
