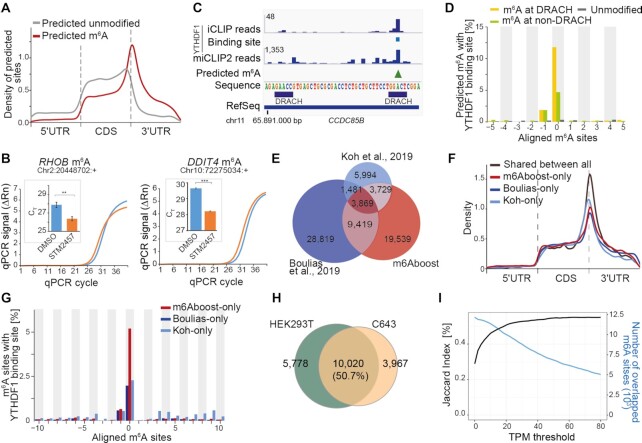
Figure 5.
m6Aboost predicts 36,556 m6A sites from HEK293T miCLIP2 data. (A) Predicted m6A sites are located around the stop codon. Visualization as in Figure 2F. (B) Selected m6A sites were validated by SELECT with HEK293T cells treated with METTL3 inhibitor (STM2457) or DMSO control. Visualization as in Figure 2H. Neighboring unmodified A nucleotides as control are given in Supplementary Figure S5C. *** P value < 0.001, ** P < 0.01, two-sided Student's t-test, n = 3. (C) Predicted m6A sites overlap with YTHDF1 binding sites. Genome browser view of the gene CCDC85B shows crosslink events from published YTHDF1 iCLIP data for HEK293T together with miCLIP2 signal (merge of four replicates) and m6Aboost-predicted m6A site (green arrowhead) from our HEK293T miCLIP2 data. (D) YTHDF1 precisely binds at the predicted m6A sites. Percentage of m6A sites (position 0) with YTHDF1 binding sites (y-axis) in a 21-nt window are given for predicted m6A sites at DRACH (yellow) and non-DRACH (green), as well as predicted unmodified sites (grey). (E) Predicted m6A sites from HEK293T miCLIP2 overlap with published m6A data. Venn diagram shows single-nucleotide overlap with miCLIP and m6ACE-seq data (m6A antibody by Synaptic Systems and Abcam, respectively). Note that m6A sites in Boulias et al., 2019 had been filtered for DRACH motifs. (F, G) Analysis of m6A sites that are unique to one of the three datasets compared in (E). (F) Unique m6A sites accumulate around stop codons. Visualization as in Figure 2F. (G) Unique m6A sites are enriched in YTHDF1 binding sites. Visualization as in (D). (H) Most m6A sites are shared between two different human cell lines. Venn diagram shows overlap of predicted m6A sites in expressed genes (TPM ≥ 20, n = 3,298) from HEK293T and C643 cells. A Venn diagram without expression filter is shown in Supplementary Figure S5E. (I) More m6A sites are shared between two human cell lines in higher expressed genes. TPM threshold representing the gene expression (x-axis) against the Jaccard index (y-axis). Numbers of overlapping m6A sites are shown as comparison (blue).

