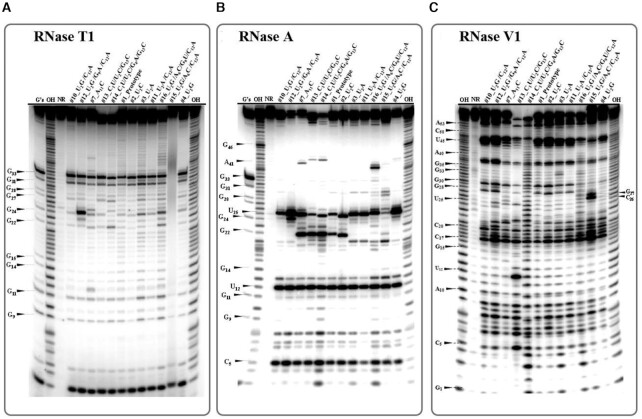
Figure 9.
Representative autoradiograms of 15% denaturing gel and cleavage pattern of RNA hairpins by nucleases. The data represents cleavage pattern of 5′-end labeled RNA hairpins treated with specific nucleases shown on the top of each panel: (A) RNase T1, (B) Rnase A, and (C) RNase V1. Lanes: ‘G’s’ is RNase T1 sequencing reaction in presence of 8M urea; ‘OH’ are - base hydrolysis ladders; ‘NR’ is nuclease free RNA molecules (control); other lanes correspond to the names of individual RNA molecules treated with nucleases.

