
Figure 1.
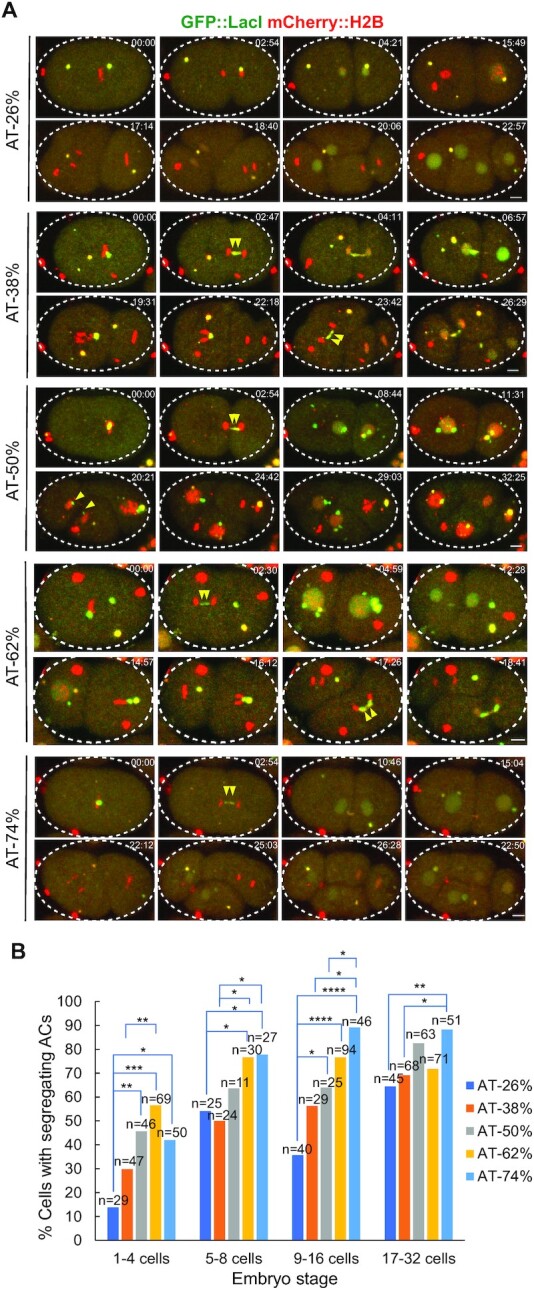
The relationship between AT-contents of injected DNA sequences and AC segregation rates. Ten 1.2-kb long, random sequences were synthesized for each AT-content, including 26% AT, 38% AT, 50% AT, 62% AT and 74% AT. Each sequence has a 18-bp LacI binding site, the LacO sequence (AATTGTGAGCGCTCACAA), at both ends. The 10 random sequences with a specific AT% were combined, and injected as a mix at 100 ng/μl. (A) Representative embryos expressing GFP::LacI (green) and mCherry::H2B (red) and carrying ACs with different AT% are shown by live-cell time-lapse imaging. Double yellow arrowheads point to the AC undergoing segregation (either lagging or successfully segregated) from 1-cell to 4-cell stage. The time (mm:ss) is indicated on the top right of images. Scale bar represents 5 μm. (B) Quantification of the percentage of cells with segregating ACs, among all dividing cells containing ACs, after injection of synthetic DNA fragment pools with different AT-contents. The number of cells (n) analyzed was indicated. Fisher's exact test was used to test for significance. *P < 0.05, **P < 0.01, ***P < 0.001 and ****P < 0.0001.