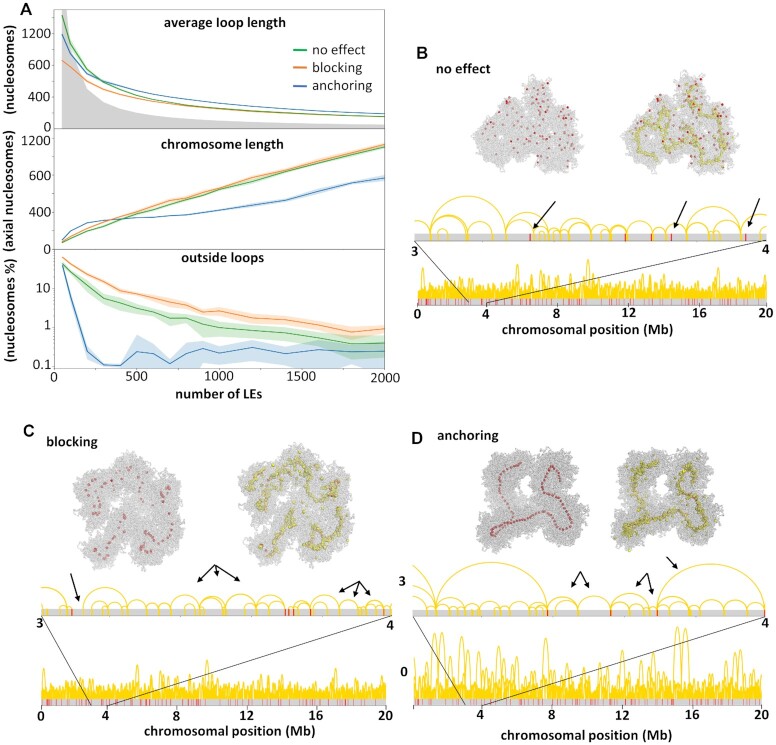
Figure 4.
Effects of centromeric units. (A) Chromosome length and average loop length as a function of the number of simulated LEs, and the number of nudeosomes outside chromatin loops. These parameters were calculated from simulations considering three different effects (no effect, blocking or anchoring) of centromeric units in the loop extrusion process. The grey area characterizes sparse states, when the number of LEs times the average loop length is <100 000 nucleosome. Above the grey area the chromosome is in a compacted state, with nested chromatin loops. (B–D) Final conformations of three simulations (100 000 3D steps long) with different centromeric effects (see Supplementary Movies S1–3 for simulation examples). The distribution of centromeric nucleosomes (red) and LEs (yellow) is shown in the chromatin fibre (grey), in the 3D structure (top) and sequence (bottom). For each conformation arrows indicate characteristic loop organizations. (B) With no effect, loops are observed spanning centromeric nucleosomes. (C) With the blocking effect, regions are observed outside loops as well as multiple loops between two adjacent centromeric nucleosomes. (D) With the anchoring effect, only one or two loops are observed between adjacent centromeric nucleosomes.

