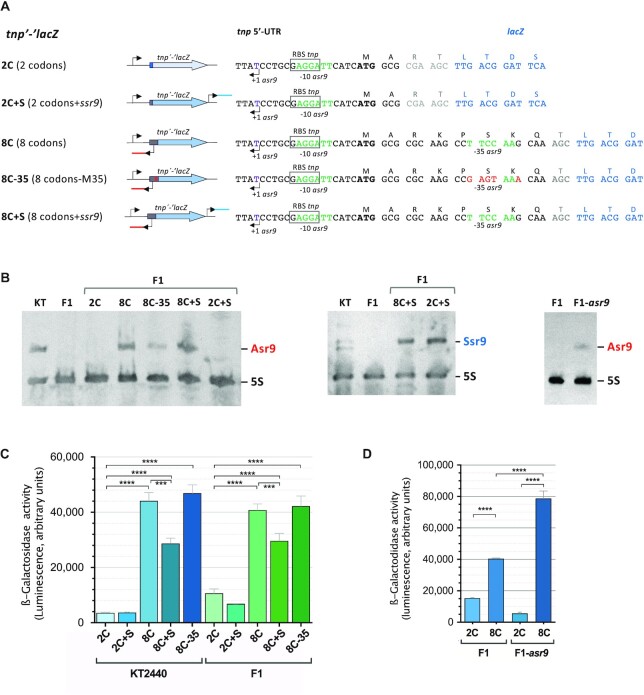
Figure 4.
Influence of the 5′-UTR, Asr9 and Ssr9 on the expression of tnp, as determined by translational fusions to the ‘lacZ reporter gene. (A) Diagram showing the translational fusions to ‘lacZ constructed. The name of the fusion is on the left, followed by a diagram and a detailed description of the fusion region (right). Bent arrows indicate transcription start sites. The red and blue lines reporter construction diagram denote asr9 and ssr9 respectively, while the gray and blue regions of the thick arrow correspond to the first tnp codons (gray) and the ‘lacZ gene (blue). In the nucleotide sequences (right), positions in black font correspond to tnp, those in blue to ‘lacZ, and those in gray to extra codons introduced during cloning procedures. Positions mutated at the -35 region of promoter Pasr9 are indicated in red font (construction 8C-35). (B) Presence or absence of Asr9 or Ssr9 in strains KT2440, F1, F1-asr or F1 containing the plasmids that include the translational fusions indicated in (A), determined by northern blots. (C and D) Levels of β-galactosidase observed in cells of strains K2440, F1 or F1-asr9 containing reporter plasmids including the indicated translational fusion (2C, 2C + S, 8C, 8C + S or 8C-35; see panel ‘A’ for a description of each fusion). Values represent the mean and the standard deviation of three biological replicates; cells were collected in mid-exponential phase (A600 of 0.5). Asterisks indicate significant differences between sample pairs specified by brackets (one-way ANOVA; ****P< 0.0001; ***P< 0.001).

