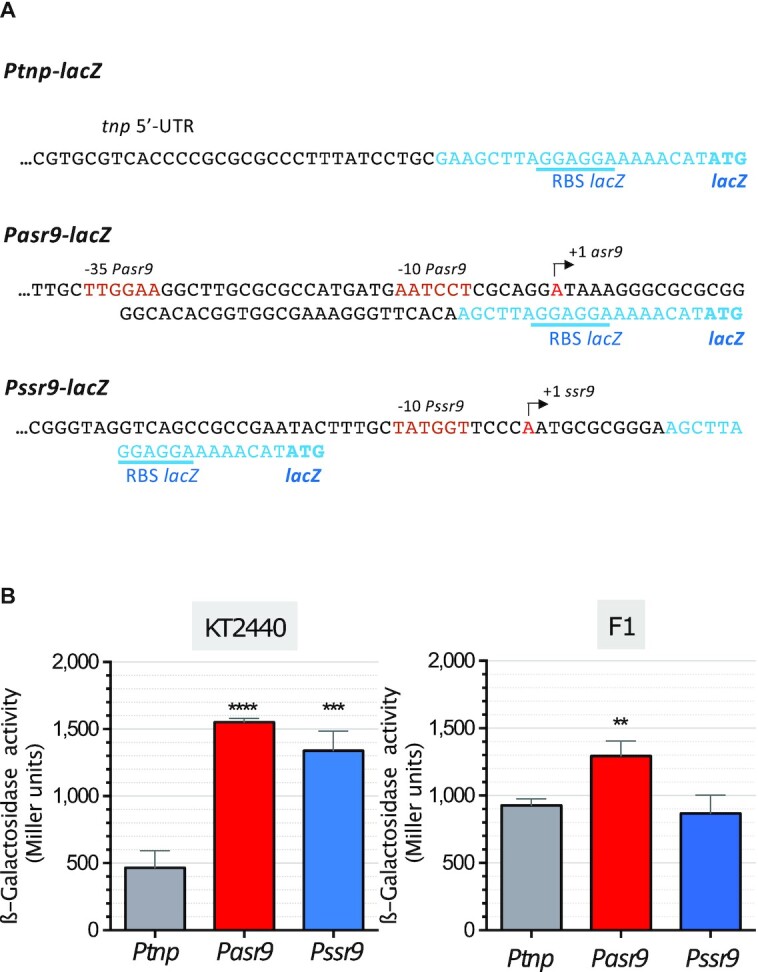
Figure 7.

Activity of promoters Ptnp, Pasr9 and Pssr9. (A) Transcriptional fusions to lacZ used to determine the activity of the indicated promoters; the sequences corresponding to lacZ are indicated in blue font. (B) The transcriptional fusions indicated in (A), cloned into a broad-host-range plasmid vector, were introduced into P. putida strains KT2440 and F1, and the β-galactosidase activity determined when cells reached a turbidity (A600) of 0.5. Values represent the mean and the standard deviation of three biological replicates. Asterisks indicate significant differences between the values recorded for Pasr9 or Pssr9 relative to Ptnp (one-way ANOVA; ****P< 0.0001; ***P< 0.001; **P< 0.01).
