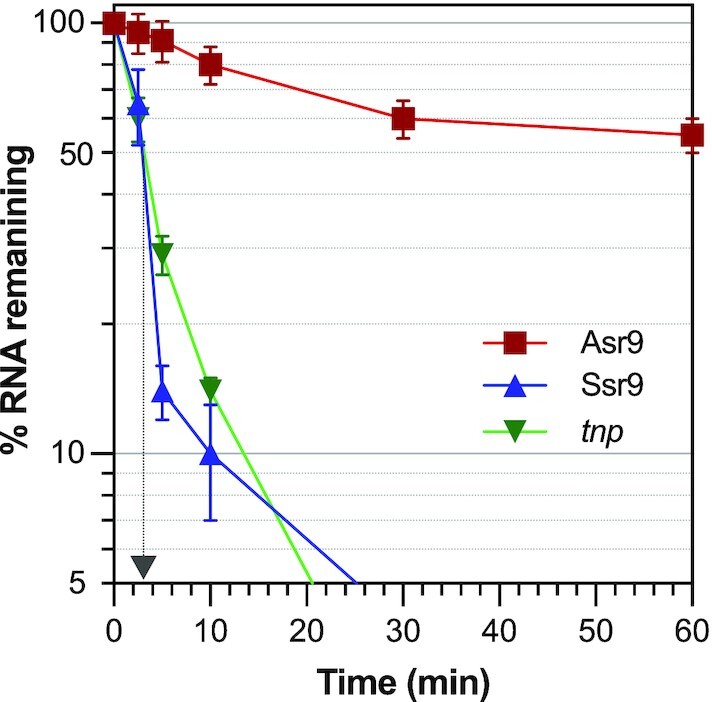
Figure 8.

Stability of Asr9 and Ssr9 sRNAs, and of tnp mRNA. The amount of Asr9 (red line), Ssr9 (blue line) or tnp mRNA (green line) in KT2440 cells was determined by RT-qPCR at different times after blocking transcription by the addition of rifampicin. Values show the percentage of each RNA observed at the indicated times relative to time zero, normalized for the amount of 5S rRNA detected in each sample. Values correspond to the mean for three independent assays. The time at which only 50% of the initial amount of Ssr9 and tnp RNAs remained is indicated by an arrow (∼3 min).
