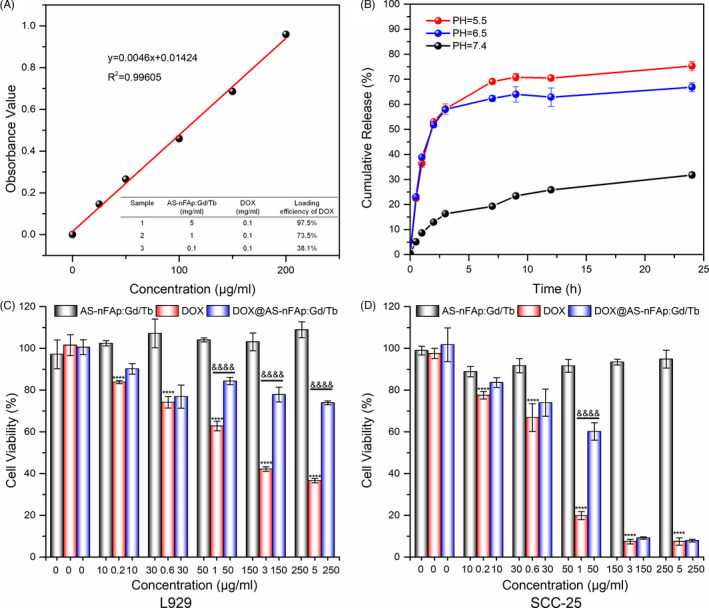
FIGURE 5.

Drug loading capacity and cytotoxicity in vitro. (A), The standard dilution curve of DOX at different concentrations, table inserted shows the loading efficiency of DOX in DOX@AS‐nFAp:Gd/Tb; (B), The release profiles of DOX from DOX@AS‐nFAp:Gd/Tb in different pH buffers (n = 3); (C) and (D), The cell viability of L929 and SCC‐25 cells after treated with AS‐nFAp:Gd/Tb, DOX and DOX@AS‐nFAp:Gd/Tb at different concentrations for 24 h (the content of DOX in DOX@AS‐nFAp:Gd/Tb group was equivalent to the pure DOX group). ****P < .0001, &&&& P < .0001, * represents different concentrations vs ctrl in DOX group, & represents DOX group vs DOX@AS:nFAp:Gd/Tb at the same concentration, data are shown as mean ± SD (n ≥ 3)
