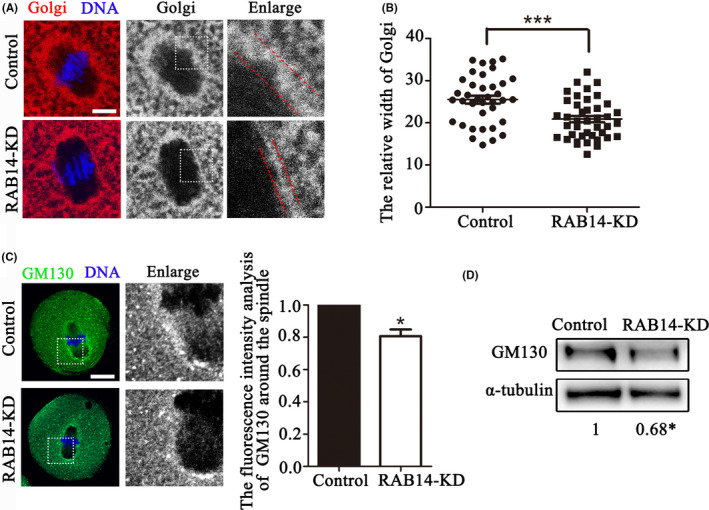
FIGURE 5.

RAB14 knockdown affects Golgi apparatus distribution in mouse oocytes. (A) Representative images for the distribution of the Golgi apparatus in the control and RAB14‐KD oocytes. Red, Golgi; blue, DNA. Bar = 5 μm. (B) The relative width of the Golgi apparatus in the control and RAB14‐KD oocytes. ***, significant difference (P < .001). (C) Representative images of GM130 distribution in the control and RAB14‐KD oocytes. Green, GM130; blue, DNA. Bar = 20 μm. The fluorescence intensities of GM130 decreased in the RAB14‐KD oocytes. *, significant difference (P < .05). (D) Quantitative analysis of the relative intensity of GM130 protein expression (relative to that of α‐tubulin) in the control and RAB14‐KD oocytes. *, significant difference (P < .05)
