
FIGURE 6.
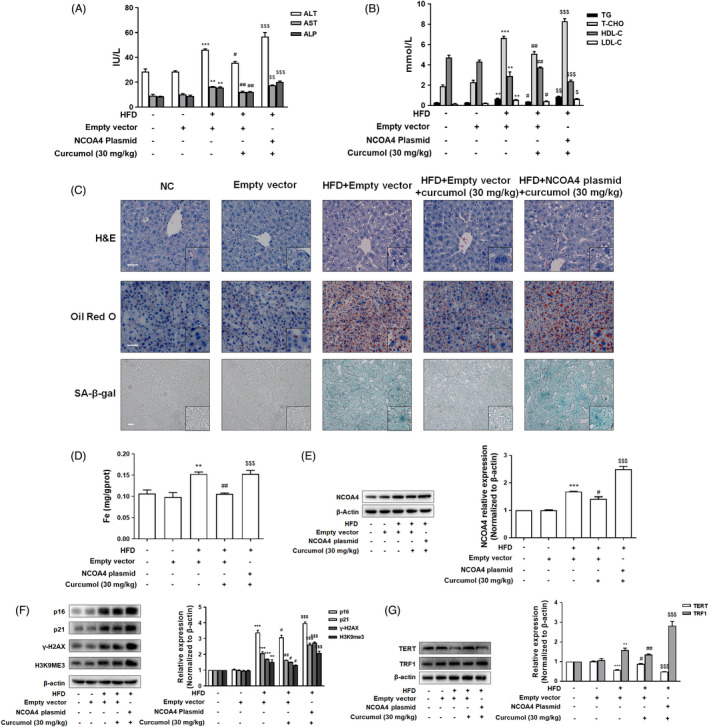
NCOA4 impaired curcumol’ inhibition of hepatocyte senescence in vivo. A,B, Serum levels of ALT, AST, ALP, TG, T‐CHO, HDL‐C and LDL‐C in golden hamsters. Data are represented as mean ± SEM. Significance: ** P < .01, *** P < .001 vs Empty vector group; # P < .05, ## P < .01 vs HFD + Empty vector group; $ P < .05, $$ P < .01, $$$ P < .001 vs HFD + Empty vector + Curcumol (30 mg/kg) group. C, Representative photographs of liver sections stained with H&E, Oil Red O and SA‐β‐gal staining. Scale bar, 50 μm (H&E, Oil Red O), 100 μm (SA‐β‐gal). D, The iron content of liver evaluated by Tissue Iron Colorimetric Assay Kit. Data are represented as mean ± SEM. Significance: ** P < .01 vs Empty vector; ## P < .01 vs HFD + Empty vector group; $$$ P < .001 vs HFD + Empty vector + Curcumol (30 mg/kg) group. E‐G, Western blot analyses of the transfection efficiency of adenovirus‐mediated NCOA4 plasmid and the protein levels of p16, p21, γ‐H2AX, H3K9me3, TERT and TRF1 in liver tissues. Data are represented as mean ± SEM. Significance: ** P < .01, *** P < .001 vs Empty vector group; # P < .05, ## P < .01 vs HFD + Empty vector group; $$$ P < .001 vs HFD + Empty vector + Curcumol (30 mg/kg) group