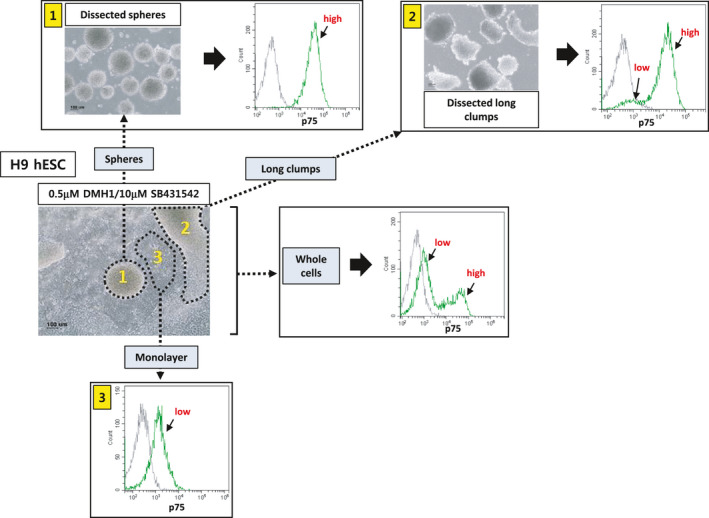
FIGURE 2.

Flow cytometric analysis of the cell populations present at day 9 after differentiation. H9 hESCs were differentiated into NCSCs via EB formation using modified dual‐SMAD inhibition (0.5 μmol/L DMH1/10 μmol/L SB431542). Three different areas/structures (ie, spherical cell clumps (‘1’), non‐spherical long clumps with comet tails (‘2’) and monolayer cells (‘3’)) were dissected mechanically and subjected to flow cytometry using an antibody against p75. Independently, whole cells were also analysed by flow cytometry. Scale bar: 100 μm
