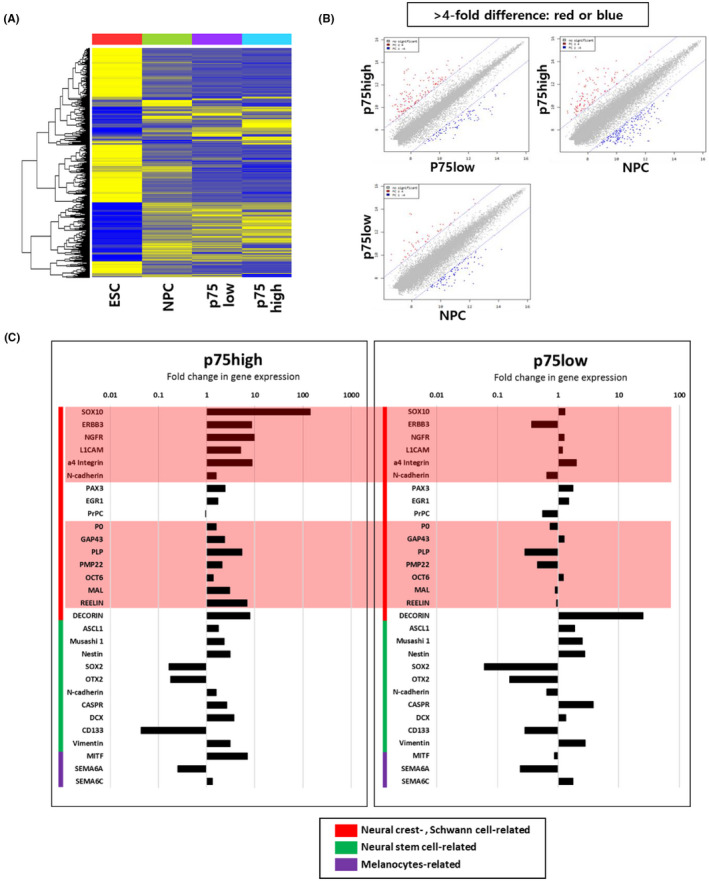
FIGURE 4.

Global gene expression analysis of p75high and p75low cell populations. (A) Heatmap of the microarray data from ESCs, NPCs, p75low cells and p75low cells. (B) Scatter plot of gene expression profiles for p75high cells—p75low cells, p75high cells—NPCs and p75low cells—NPCs. The genes that were differentially expressed by more than 4‐fold are indicated as red or blue dots. (C) Fold differences in genes associated with the neural crest, Schwann cells, neural stem cells and melanocytes were compared between p75high and p75low cells. All values are relative to undifferentiated hESC. The genes that are highly differentially expressed between p75high and p75low cells are denoted in pink boxes
