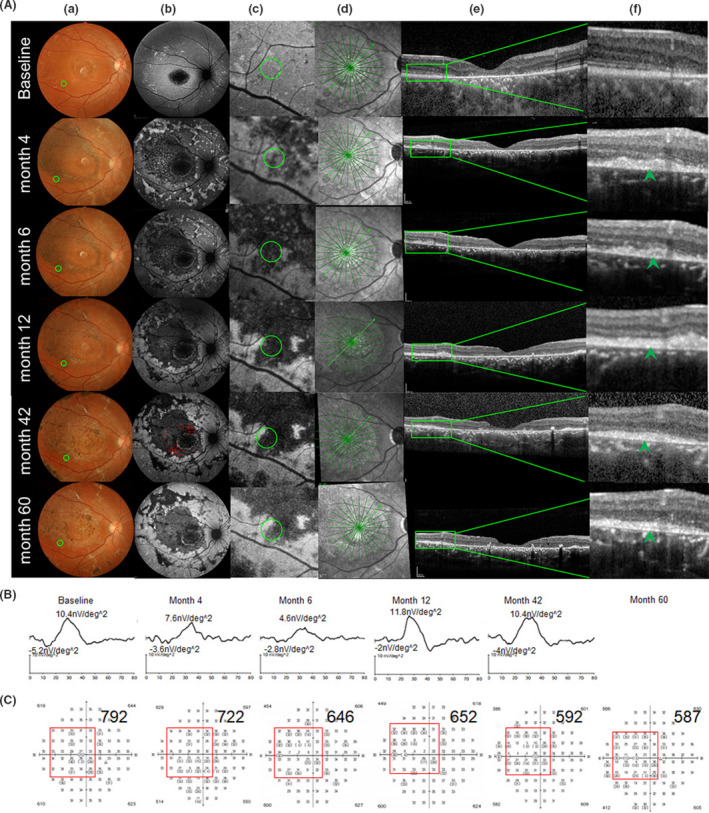
FIGURE 6.

Morphological (A) and function (B,C) change in the operated eye of patient 2, who was classified as a Category III patient. Hyperfluorescence dots were detected by AF inside and outside of the first vascular arch of the posterior pole (FVAPP) before surgery (baseline b). Fundus photography (a), autofluorescence of the posterior pole (b), typical autofluorescence changed the area near macular after surgery (green circle, c), OCT scanning position cross green circle in c (green line in the middle, d), OCT scanning image from green line in d (e), and higher magnification of OCT scanning image from the green box in e, which showed local small high reflection (SHR) (green arrow, f) at each follow‐up time. From baseline to the last visit (60th month), fundus photography (a) and autofluorescence (b) displayed scattered yellowish dots and pigmentation (a) and hypo‐autofluorescence dots (b) around the transplantation site (green circle, a), OCT scanning (e, f) showed SHR existed (green arrow, f). In the autofluorescence image at the 42nd month, we use red dots to label the SHR area (b), which were calculated separately at each time point by mfERG with nv/deg2 (g) and visual field with decibel value (h)
