
FIGURE 7.
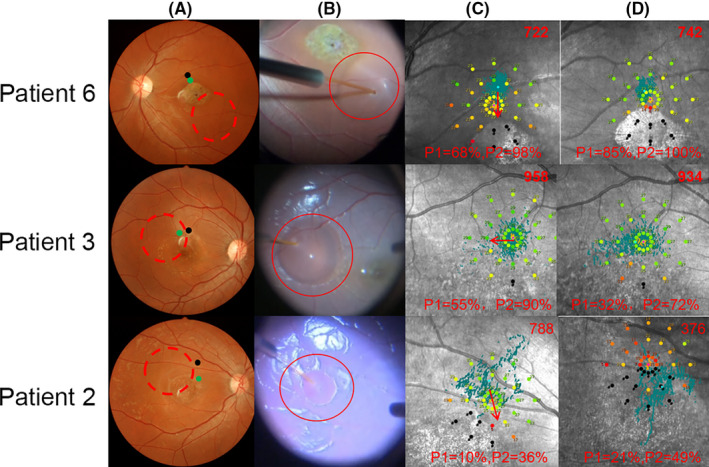
Fundus photography and macular function by microperimetry. Fundus photography before surgery (a): the area of transplanted cells spread (red dash circle), the fixation point shifted from its original position before operation (black dot, a) to a new position 12 months after operation (green dot, a). Fundus photography during the operation (b): Q‐CTS‐hESC‐2‐RPE cells were slowly injected into the subretinal space by a 41‐gauge injection cannula (red circle, b). Microperimetry before (c) and 12 months after surgery (d): the red value on the top right represents the sum of the microperimetry light thresholds, and the value on the bottom means the fixation stability at 1° (P1) and 2° (P2) area. The fixation point was plotted by the blue dots, and shift of fixation point was showed by the red arrow (c)