
Figure 5.
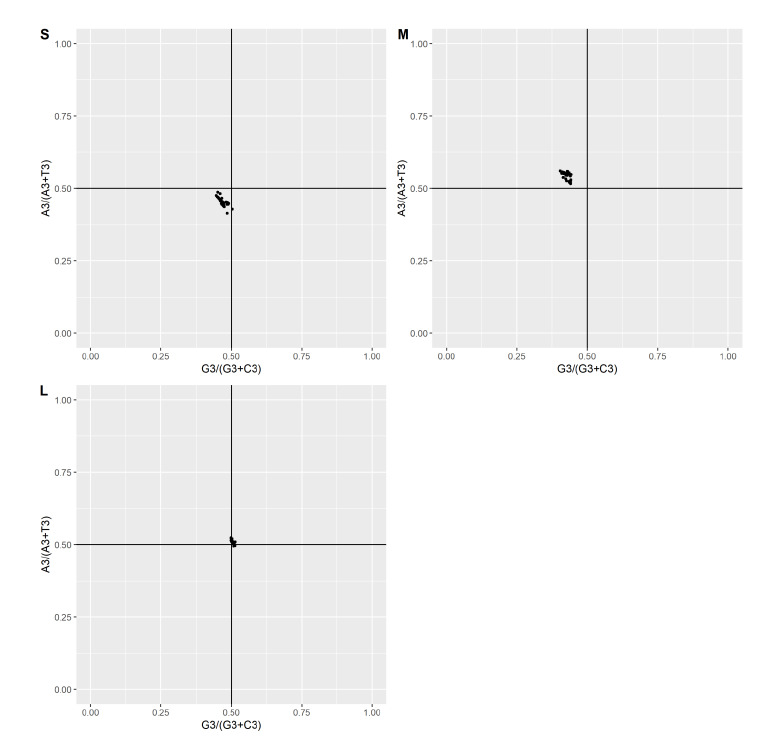
Parity Rule 2 bias plot of each segment of the CCHF virus, indicating the magnitude between natural selection and mutational pressure.
Official websites use .gov
A
.gov website belongs to an official
government organization in the United States.
Secure .gov websites use HTTPS
A lock (
) or https:// means you've safely
connected to the .gov website. Share sensitive
information only on official, secure websites.
Parity Rule 2 bias plot of each segment of the CCHF virus, indicating the magnitude between natural selection and mutational pressure.