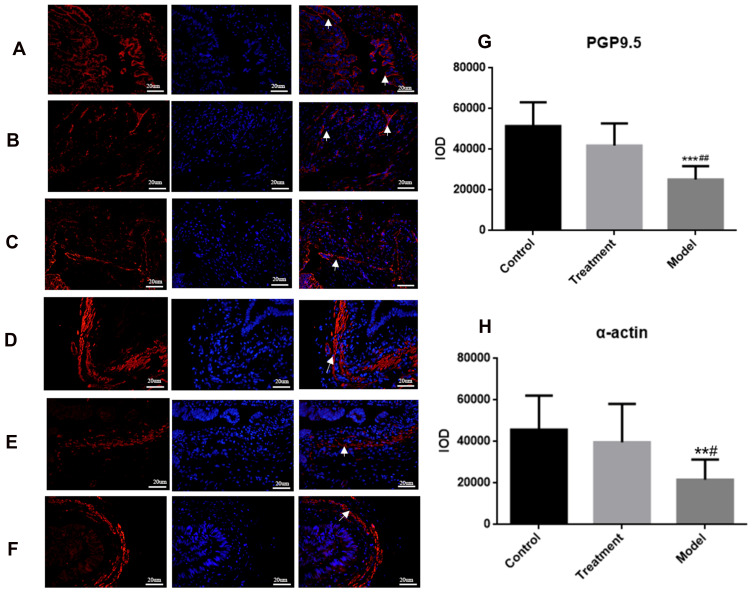
Figure 4.
(A) Normal group, (B) Model group, (C) Treatment group: Rabbit SO tissue, nerve fiber PGP9.5 in the inner muscular layer detected by laser confocal microscopy, red light is PGP9.5, blue light is DAPI. (D) Normal group, (E) Model group, (F) SGD treatment group: α-actin labeled rabbit SO tissues were examined by laser confocal microscopy (400×, 20 um), with α-actin in red light and DAPI in blue light. (G) fluorescence intensity of PGP9.5 (IOD) in the SO tissue of rabbits in each group; (H) The fluorescence intensity (IOD) of α-actin labeled SMC in the SO tissue of rabbits in each group. Arrows indicate positive expression.*** indicates the comparison between the model group and the control group, P<0.05, ##indicates the comparison between the model group and the treatment group, P<0.05. In α-action, ** indicates the comparison between the model group and the control group, P<0.05, # indicates the comparison between the model group and the treatment group, P<0.05.

