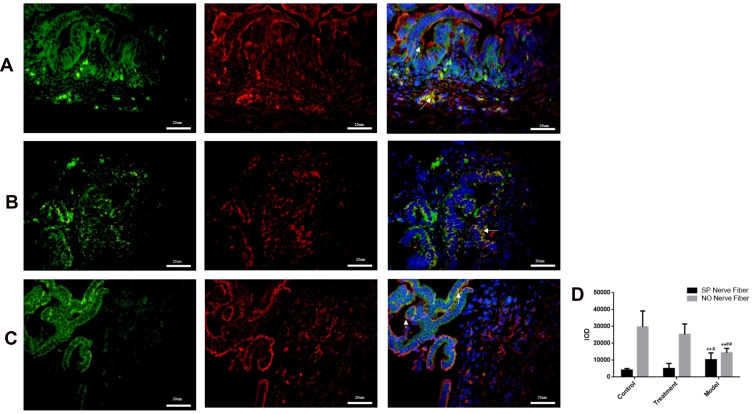
Figure 5.
(A) Normal group, (B) Model group, (C) Treatment group: Rabbit SO tissue, nerve fiber in the inner muscular layer detected by laser confocal microscopy, SP and n-NOS respectively labeled SP nerve fibers (green light) and NO nerve fibers (red light) in rabbit SO tissue. The blue light is DAPI. Arrows indicate positive expression. ** indicates that the model group is compared with the control group, p<0.05, # indicates that the model group is compared with SGD group,p<0.05.In NO, ** indicates that the model group is compared with the control group, p<0.05, ## indicates that the model group is compared with SGD group, p<0.05.

