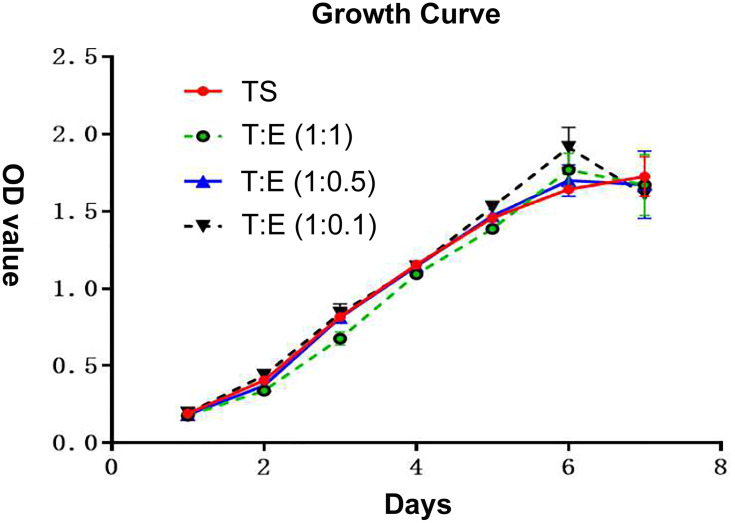
Figure 3.
According to the same grouping method as mentioned above, the growth curve was drawn after 7 days of continuous measurement of endometrial cells and oviduct mucosa cells after co-culture. It can be seen that the growth rate of oviduct mucosa cells when growing alone was similar to that of endometrial cells in different proportions when co-culture, without significantly statistical difference (P > 0.05). The growth curve is of “S” type, which means that all of them experienced three stages: slow growth stage, logarithmic growth stage and plateau stage. TS: oviduct mucosal cells were cultured alone; T:E(1:1): the proportion of oviduct mucosal cells and endometrial cells was 1:1; T:E(1:0.5): the proportion of oviduct mucosal cells and endometrial cells was 1:0.5; T:E(1:0.1): the proportion of oviduct mucosal cells and endometrial cells was 1:0.1.

