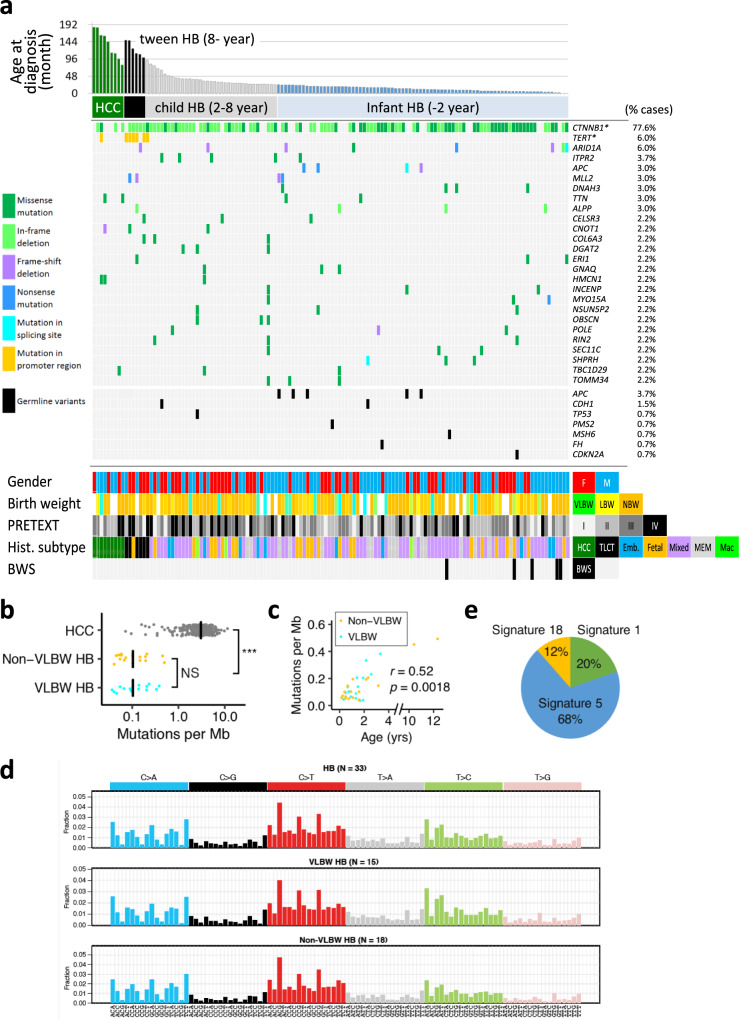
Fig. 1. Landscape of driver mutations and mutational spectrum in childhood liver neoplasms.
a A total of 134 cases (WXS: 112, WGS: 33) of childhood hepatoblastoma (HB) and hepatocellular carcinoma (HCC) were sorted by age at diagnosis. The bar graph at the top of the panel shows individual age at diagnosis (childhood HCC, n = 9; tween HB (age > 8), n = 6; child HB (age = 2–8), n = 38; infant HB (age < 2), n = 81). The middle of the panel shows the driver mutations detected in at least 3 cases in this cohort (missense mutation, dark green; in-frame deletion, light green; frame-shift deletion, purple; nonsense mutation, blue; mutation in splicing site, light blue; mutation in the promoter region, yellow) and the pathogenic germline variants (black). The image at the bottom of the panel shows clinical and pathological information. VLBW, very low birth weight (<1500 g); LBW, low birth weight (1500–2500 g); NBW, normal birth weight (2500–3500 g), HCC hepatocellular carcinoma, TLCT transitional liver cell tumor, Embry. embryonic, Macro macrotrabecular; BWS, Beckwith–Wiedemann Syndrome. b The number of somatic mutations per million base pairs of HCC (n = 269) and HB with VLBW (n = 15) and non-VLBW (n = 18) detected by WGS. Statistical significance was analyzed by Wilcoxon rank-sum test. c Correlations between the age at diagnosis and the number of somatic mutations of HB with VLBW (n = 15) and non-VLBW (n = 18). Statistical significance was analyzed by the Spearman correlation test. d Signatures of mutational processes extracted from the mutational catalog of 33 HBs with/without VLBW. e percentages of the contributing mutational signatures.

