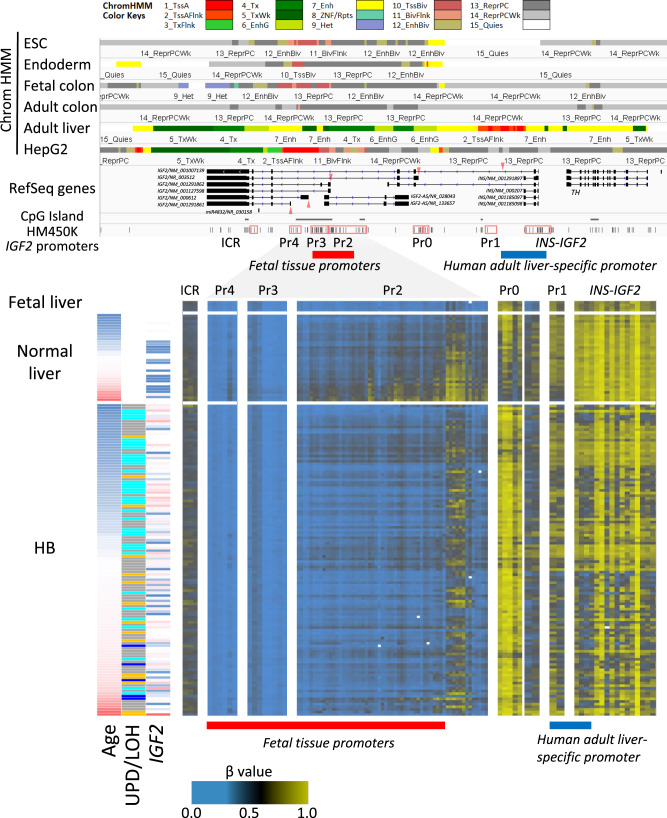
Fig. 3. Methylation statuses of IGF2 promoters in childhood hepatoblastoma (HB).
Methylation statuses of the IGF2 promoters across 146 HB and 13 normal livers. The top panel represents chromatin statuses of human embryonic stem cells (H9, E003), their vitro derivative cells toward endoderm lineage (E011), fetal colon (E084), adult colon (E106), and adult liver tissues (E066), as defined in the Roadmap Epigenomics project (https://egg2.wustl.edu/roadmap/web_portal/index.html) around the IGF2 gene (chr11:2,140,000-2,195,000). 1_TssA (Red), Active TSS; 2_TssAFlnk (Orange Red), Flanking Active TSS; 3_TxFlnk (LimeGreen), Transcr. at gene 5’ and 3’; 4_Tx (Green), Strong transcription; 5_TxWk (DarkGreen), Weak transcription; 6_EnhG (GreenYellow), Genic enhancers; 7_Enh (Yellow), Enhancers; 8_ZNF/Rpts (Medium Aquamarine), ZNF genes & repeats; 9_Het (Pale Turquoise), Heterochromatin; 10_TssBiv (IndianRed), Bivalent/Poised TSS; 11_BivFlnk (DarlSalmon), Flanking Bivalent TSS/Enh; 12_EnhBiv (DarkKhaki), Bivalent Enhancer; 13_ReprPC (Silver), Repressed PolyComb; 14_ReprPCWk (Gainsboro), Weak Repressed PolyComb; 15_Quies (White), Quiescent/Low. Red triangles represent the transcription start sites of five IGF2 promoters. The heat map in the bottom panel shows methylation statuses of each tumor (vertical axis) plotted in order of the physical position along with the alternative promoters (horizontal axis). The left panel shows the age at diagnosis, aberration pattern (UPD, LOH, ROH and LOI) and the expression level of IGF2 in each case.

