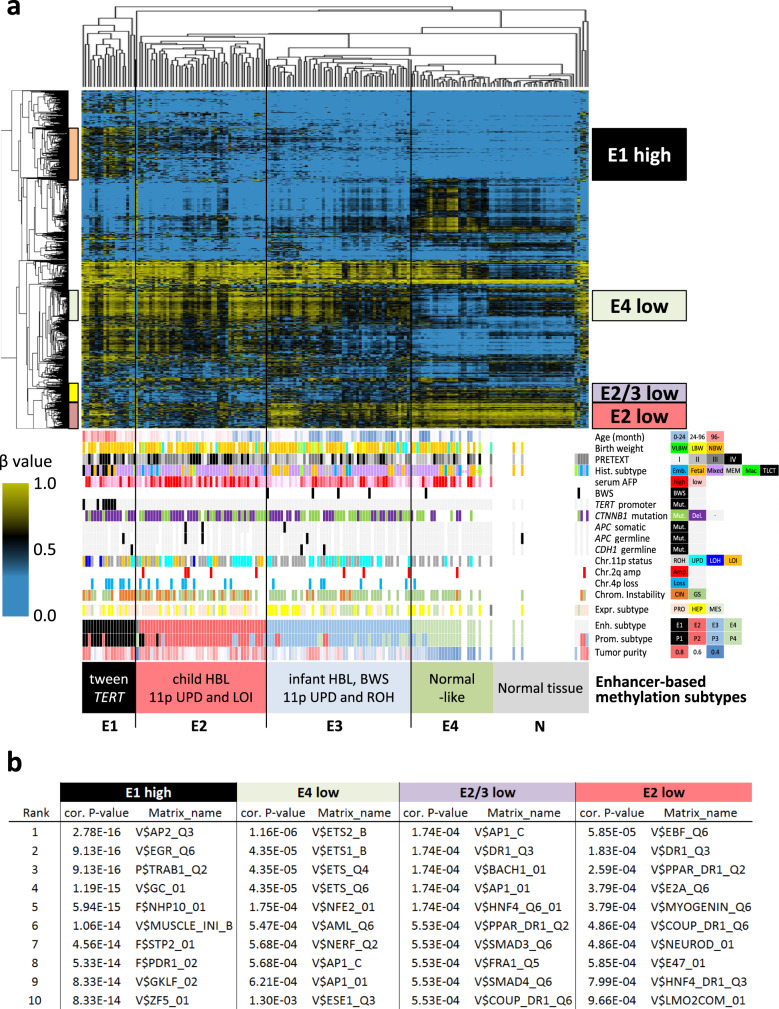
Fig. 4. Enhancer methylation subtypes and aberrant hypomethylation in hepatoblastoma.
Unsupervised clustering of 146 childhood hepatoblastoma (HB) and 11 non-cancerous livers using the most variably methylated CpGs located at the enhancer regions of adult and fetal livers. The heat map shows the methylation level of each tumor (horizontal axis) plotted by the probe sets (vertical axis) in the top panel. The bottom panel shows clinical and pathological parameters, molecularly defined subtypes of HB patients. Statistical significance was analyzed using Fisher’s exact test (*p < 0.01). b Significant motifs of transcription factors most strongly enriched in the subtype-specific hyper/hypomethylated probe sets using the TRAP (Transcription factor Affinity Prediction Web Tools). The matrix entries have an identifier that indicates one of the six groups of biological species (V$ vertebrates, I$ insects, P$ plants, F$ fungi, N$ nematodes, B$ bacteria). The P-value for each sequence was combined using the two-sided Fisher’s method and corrected for multiple testing.

