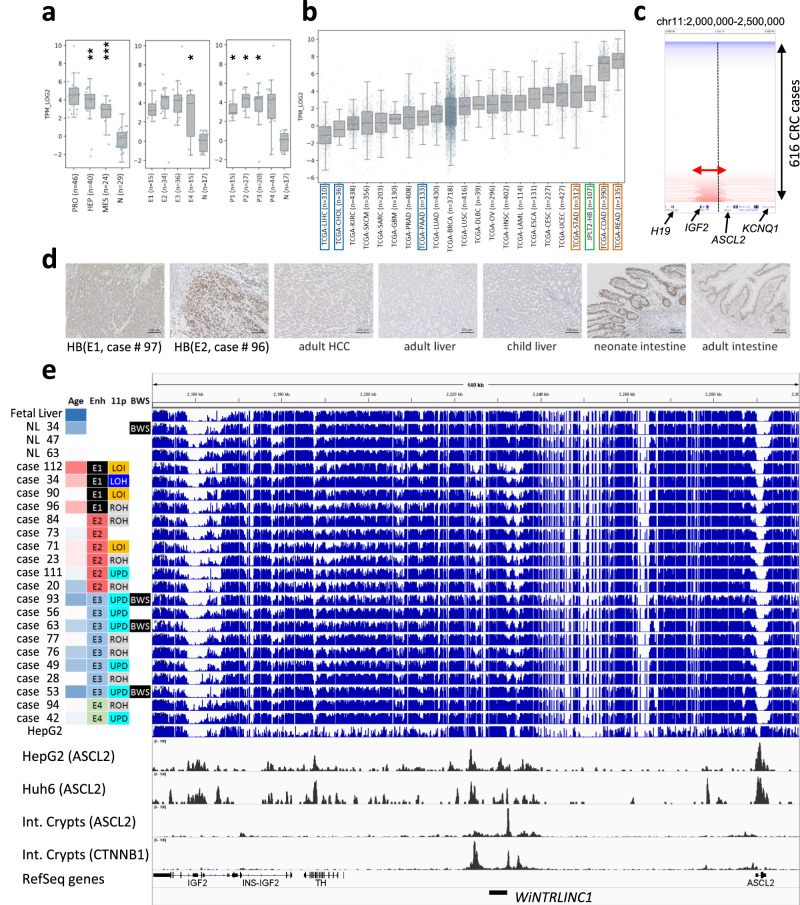
Fig. 5. Aberrant hypomethylation in the ASCL2 region.
a Expression level of ASCL2 in hepatoblastoma (HB) in this study The center lines show the medians, the tops, and bottoms of boxes show quartiles, and the whiskers show the extremes within the range of the medians ± 1.5 × the interquartile ranges, wherein *p < 0.05, **p < 0.01, ***p < 0.001, ****p < 0.0001. Statistical significance was analyzed using a two-sided Fisher’s exact test. Gene expression subgroup (left), PRO vs. N, p = 0.221; HEP vs. N, p = 0.004; MES vs. N, p < 0.001, Enhancer methylation subgroup (middle), E1 vs. N, p = 0.229; E2 vs. N, p = 0.576; E3 vs. N, p = 0.351; E4 vs. N, p = 0.047; Promoter methylation subgroup (right), P1 vs. N, p = 0.013; P2 vs. N, p = 0.041; P3 vs. N, p = 0.025; P4 vs. N, p = 0.408. b Expression level of ASCL2 in hepatoblastoma (HB) in this study and adult cancers in TCGA Pan-Cancer project. c Recurrent focal amplification in IGF2/ASCL2 region in TCGA colorectal carcinoma. d Immunohistochemical staining of ASCL2 using 100× diluted anti-ASCL2 rabbit polyclonal antibody (Biorbyt Ltd, Cambridge, UK), in the series of human liver, intestine, and tumor samples. This immunological analysis was repeated independently one other time with a similar result. e Landscape of the methylation statuses of the IGF2/ASCL2 regions analyzed using whole-genome bisulfite sequencing (blue bar graphs, 21 HB, 3 normal livers, and the liver cancer cell line, HepG2). The bottom two rows (black) represent the ChIP-sequencing data (CTNNB1 and ASCL2) obtained using the human intestinal crypts35 and hepatoblastoma cell lines, HepG2 and Huh7. Clinical and molecular parameters (Age age at diagnosis, Enh enhancer methylation subtype, 11p copy number status of chromosome 11p, BWS Beckwith–Wiedemann syndrome) are shown on the left of the bar graph.

