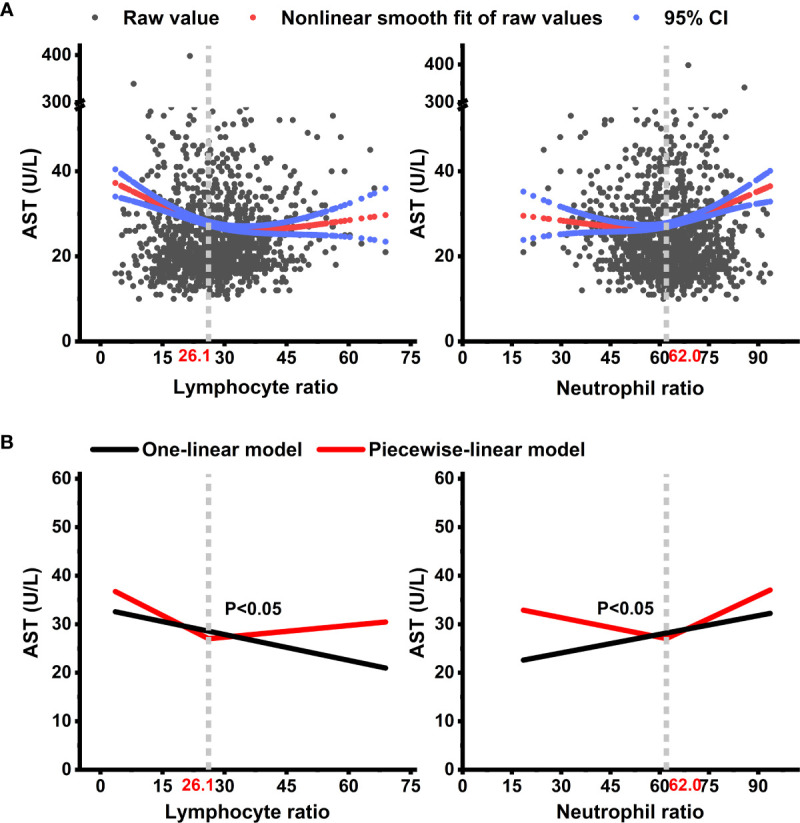
Figure 2.

Non-linear trajectories of AST with the changes of lymphocyte ratio and neutrophil ratio during the lateral observation period among COVID-19 patients. Non-linear trajectories of AST with the changes of lymphocyte ratio and neutrophil ratio can be approximated with a piecewise-linear mixed effect model. (A) shows the adjusted smooth fit of AST data. (B) shows the fit from the adjusted one-linear and adjusted piecewise-linear mixed-effect models. Models adjusted for fixed covariates including age, sex, body mass index (BMI), SBP, smoking, alcohol, highest temperature, chest congestion, liver cirrhosis, HBV, and clinical classification on admission, and time-varied covariates including white blood cell count (WBC), rapid C-reactive protein (RCP), serum amyloid A protein (SAA), alkaline phosphatase (ALP), activated partial thromboplastin time (APTT), glomerular filtration rate (GFR), lipoprotein A (LppA), hemoglobin (Hb), sodium concentration, actual base excess (ABE), and anion gap (AG) during the lateral observation period. AST, aspartate transaminase; CI, confidence interval.
