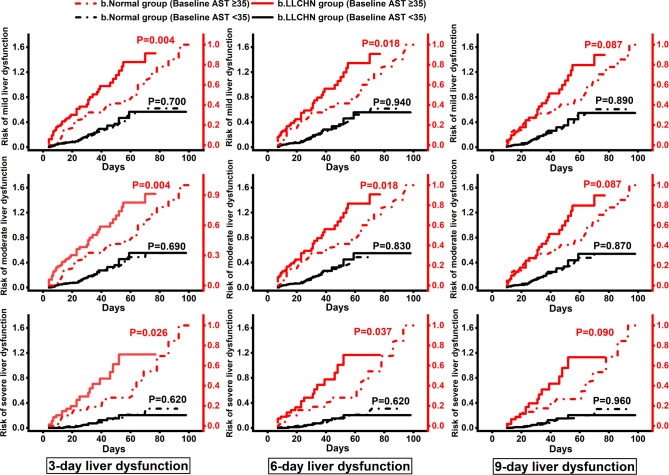
Figure 3.
Kaplan–Meier Curves for the cumulative risk of 3-, 6-, and 9-day liver dysfunction in the b.LLCHN group and the b.normal group. Kaplan–Meier curves were divided into two parts by the baseline levels of AST. Participants with the peak values of lymphocyte ratio ≤26.1 and neutrophil ratio ≥62.0 within 3 days of admission were classified as b.LLCHN group, and others were classified as b.Normal group. AST, aspartate transaminase; CI, confidence interval.

