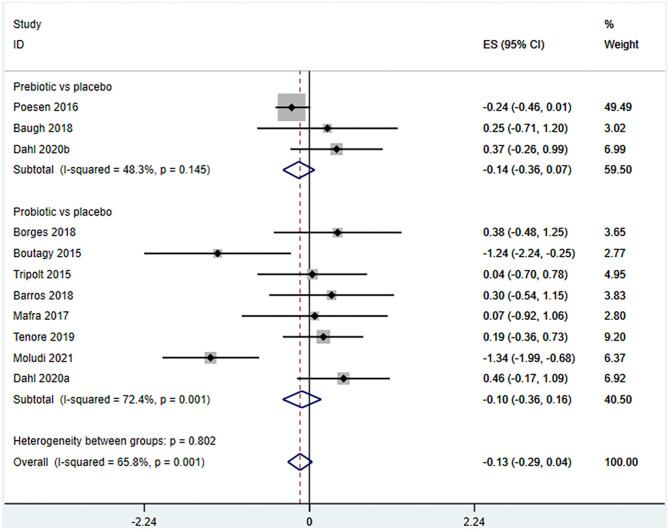
Figure 5.
Forest plot for the effect of microbiota-driven therapy on circulating TMAO level (subgroup analysis). The effect size of each trial or the overall was represented as black diamond and the weight of each trail in the overall study was represented as gray box around black diamond. The estimated 95% confidence interval of effect size was identified by extending lines. CI, confidence interval; RCT, randomized controlled trial; SMD, Standard Mean Difference.

