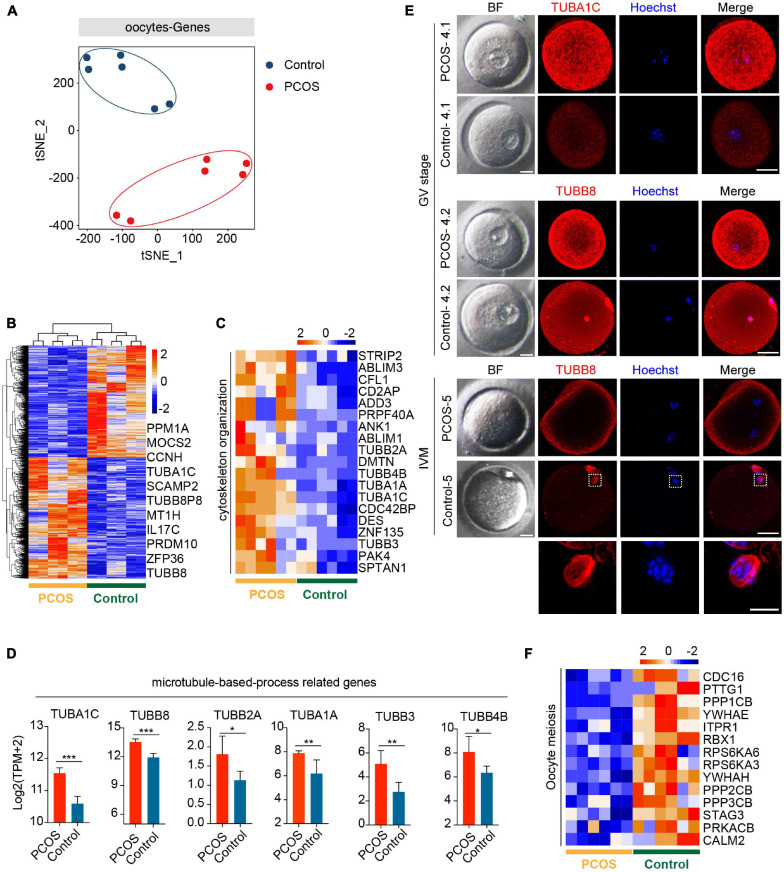
FIGURE 1.
Global gene expression profile distinguishes polycystic ovary syndrome (PCOS) from control oocytes. (A) Visualization of the gene expression of six oocytes by t-SNE, which are clustered into two subpopulations including the control group and the PCOS group; the red and blue points represent PCOS and control oocytes, respectively. (B) Heat map displaying differentially expressed genes (DEGs) in oocytes between PCOS and control. The number of up-DEGs is 1,433 and down-DEGs is 1,322. The color key from blue to red indicates the relative gene expression levels from low to high, respectively. (C) Heat map of genes involved in cytoskeleton organization that were upregulated in PCOS oocytes. (D) Six genes associated with a microtubule-based process. The red and blue bars represent PCOS and control, respectively. The gene expression levels are represented by log2 [TPM + 2], and data represents mean ± SD. n = 3 (participants). *p < 0.05, **p < 0.01, ***p < 0.001, ns, not significant. (E) Bright-field and immunofluorescence images of TUBA1C and TUBB8 in normal and PCOS oocytes at the germinal vesicle (GV) stage or metaphase II (MII) stage after in vitro maturation. Upper panel, oocytes (PCOS and control) at GV stage and two PCOS oocytes or two control oocytes were obtained from the same person. Lower panel, oocytes (PCOS and control) after in vitro maturation. Hoechst (blue) was used to counterstain and visualize DNA. Scale bar represents 20 μm. The magnifications of the spindle regions are shown at the bottom, and the scale bar is 10 μm (bottom). (F) Heat map of genes associated with oocyte meiosis downregulated in PCOS oocytes.

