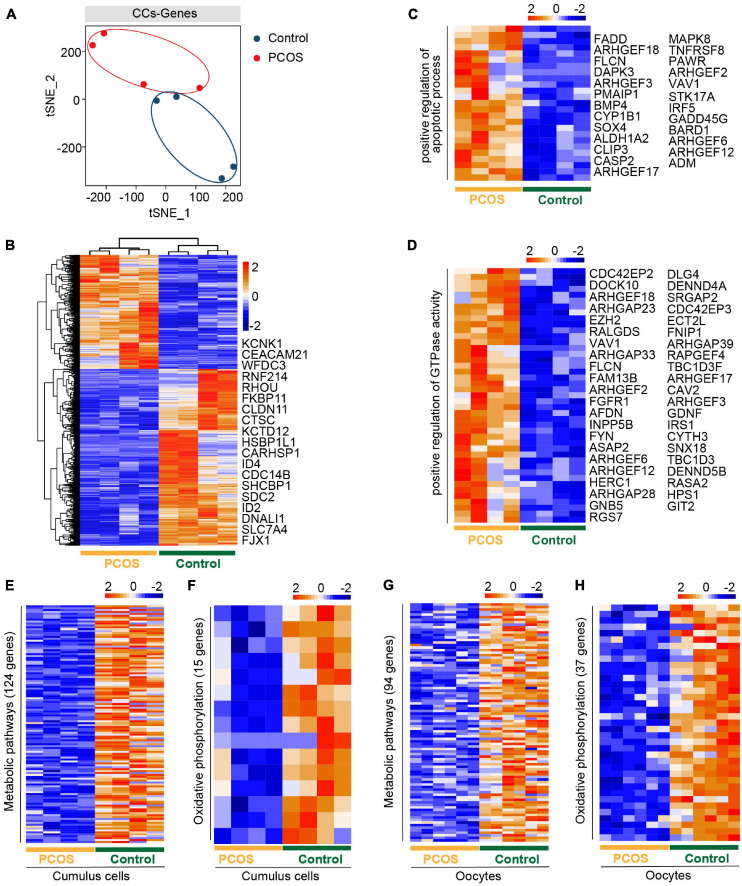
FIGURE 2.
The gene expression pattern differs between PCOS and control cumulus cells (CCs). (A) Visualization of gene expression by RNA-seq from four CC samples by t-SNE, showing that CCs are clustered into two distinct subpopulations. The red and blue points represent PCOS and control CCs, respectively. (B) Heat map of DEGs in CCs between PCOS and control. The number of up-DEGs is 704 and down-DEGs is 1,091. The color key from blue to red indicates the relative gene expression levels from low to high, respectively. (C) Heatmap of genes involved in the positive regulation of apoptotic process upregulated in PCOS CCs. (D) Heat map of genes related to the positive regulation of GTPase activity upregulated in PCOS CCs. (E) Heat map of genes involved in metabolic pathways downregulated in PCOS CCs. (F) Heat map of genes involved in oxidative phosphorylation downregulated in PCOS CCs. (G) Heat map of genes related to metabolic pathways downregulated in PCOS oocytes. (H) Heat map of genes related to oxidative phosphorylation downregulated in PCOS oocytes.

